INTRODUCTION
Following advances in human brain imaging technologies, there have been several diverse studies using high quality brain magnetic resonance imaging (MRI) in both research and clinical fields.1234 In many studies comparing brain MR images between different groups, a standard brain atlas or template is necessary to objectively localize and compare specific target regions in individual brains because of differences in shape, size, and relative orientation. A brain template provides a standard anatomical reference for individual- or population-based assessments of brain structure and function. Spatial normalization to the brain template, which serves as a common coordinate system to control for anatomical differences in individual brains, is an important processing step in computational brain MRI analysis.56789
A commonly used human brain coordinate system was initially presented by Talairach and Tournoux.1011 The Talairach atlas was created from the postmortem sections of a 60-year-old French woman; therefore, it was often criticized for being biased towards the subject of choice and lacking group-representative anatomical features. The International Consortium for Brain Mapping (ICBM) created another standard brain template to address the limitations of the Talairach atlas by averaging a large group of MRI scans from 305 young normal subjects (M/F=239/66, 23.4±4.1 years). These scans were first spatially normalized to the Talairach space by linear registration and then averaged.59 One of the most popular brain templates is the ICBM152 atlas, which was created by averaging 152 normal MRI scans aligned into a common space using a 9-parameter transformation.121314 Recently, a nonlinear version of the ICBM atlas has been introduced.1516 The ICBM templates are adopted by many groups and incorporated in various MR image analysis tools, such as Statistical Parametric Mapping (SPM, Institute of Neurology, University College of London, UK),17 MriStudio,18 and FMRIB Software Library (FSL, University of Oxford, UK).1920
However, these brain templates do not account for differences across phenotypic groups (e.g., age, gender, race, or disease conditions).2122232425 The use of brain atlases in spatial normalization is typically limited to studies involving subject cohorts of similar phenotype; therefore, new population-specific brain templates have been created and recommended for use with other cohorts that are substantially different from the populations that were used to generate the existent templates.242526 It has been demonstrated that Oriental and Occidental populations are dissimilar due to environmental and genetic influences.2728 Thus, any deviation between the Caucasian brain template and subjects from Oriental cohorts leads to erroneous results in anatomical localization. Consequently, this can lessen the accuracy and power of any statistical analysis of the spatially normalized images.
For this reason, several efforts have been made to create an Asian population template, taking into account racial differences in brain shape and size, which can be used to perform spatial normalization processing. Lee et al.29 have constructed a Korean brain template using MRI and Positron-Emission Tomography (PET) images of 78 normal right-handed Koreans aged between 18 to 77 years (M/F=49/29, 44.6±19.4 years). Tang et al.30 have created a Chinese brain template from 56 right-handed Chinese young male subjects (24.46±1.81 years). Sato et al.31 have developed a database of brain images from 1547 healthy Japanese subjects, aged 16 to 79 years, and Uchiyama et al.32 have created a brain template of 180 Japanese children (M/F=75/105) between the ages of 5 and 9 years. However, to the best of our knowledge, no previous study has quantitatively validated these Asian templates by comparison with the ICBM templates, in terms of the registration-induced deformation.
In this study, we constructed a brain MRI template from Korean normal elderly subjects that would be fundamental for brain MRI studies about aging and geriatric. Specifically, we constructed a Korean normal elderly template (i.e., KNE96 template) using 3.0T T1 structural MRI images from 96 Korean elderly subjects. Further, we validated the KNE96 template by comparing with the ICBM152 template, which is one of most popular templates based on a Caucasian population. Using 48 Korean elderly subjects, we validated the KNE96 template by comparing the deformation produced by image registration to the KNE96 template with that to the ICBM152 template.
METHODS
Study population
144 righted-handed Korean elderly subjects with normal cognition were selected from participants of the Korean Longitudinal Study on Cognitive Aging and Dementia (KLOSCAD), which is a population-based prospective elderly cohort study on cognitive aging and dementia that was launched in 2009.33 Participants of KLOSCAD were drawn from individuals aged 60 years or older. All participants assessed on clinical grounds to be cognitively normal in accordance with a Clinical Dementia Rating (CDR)34 scale of 0. Participants who had Axis I disorders listed in the DSM-IV35 or any serious medical or neurological disorders that could affect their cognitive function were excluded. Each subject was evaluated using the Korean version of the Consortium to Establish a Registry for Alzheimer's Disease (CERAD-K)36 by a research geropsychiatrist with expertise in dementia research. The Edinburgh handedness inventory was used to assess handedness.37 According to these criteria, we selected 144 righted-handed Korean elderly subjects with normal cognition for this study. This study protocol was approved by the Institutional Review Board of Seoul National University Bundang Hospital (SNUBH). All subjects were fully informed about the study protocol. All subjects provided written informed consents that were signed by the subjects.
The 144 subjects were divided into two groups. 96 subjects (M/F=48/48) aged 60 years or older (M=69.5±6.2 years, F=70.1±7.0 years) were used to construct a Korean normal elderly template (i.e., KNE96 template), and the remaining 48 subjects (M/F=24/24) aged 60 years of older (M=71.5±5.9 years, F=72.8±5.1 years) were used to validate the KNE96 template. The sex and age distribution of the two groups of subjects is shown in Table 1.
Image acquisition and preparation
Three-dimensional (3D) T1-weighted spoiled gradient echo (SPGR) MRI images were acquired from all subjects on a 3.0Tesla GE SIGNA scanner (GE Medical Systems, Milwaukee, USA). The imaging parameters were as follows: 1.0 mm sagital slices, echo time (TE) of 3.68 ms, repetition time (TR) of 25.0 ms, flip angle of 30°, and field of view (FOV) of 24×24 cm. The acquisition matrix was 175×240×240 in the x-, y-, and z-dimensions yielding a voxel size of 1.0×1.0×1.0 mm3.
All data were acquired in DICOM format and then imported into ANALYZE format for analysis using the import function in SPM8. Each MRI scan was reoriented to virtual x-y-z coordinates so that the anterior commissural-posterior commissural (AC-PC) line of the brain was matched to the y-axis, the vertical anterior commissural (VAC) line to the z-axis, and the midsagittal plane to the y-z plane.
Global brain features
Global brain shape and size are useful baselines for characterizing and comparing individual brains, although they do not provide detailed morphometry. Length, width, height, and volume of the whole brain are used as representative features of global brain shape and size. We measured the global brain features of each brain of 96 subjects in the construction group. We manually specified six reference points using BrainSuite:3839 the most anterior (AP), posterior (PP), right (RP), left (LP), superior (SP), and inferior (IP) points of the cerebrum. The length, width, and height of the whole brain were determined as the distances between AP and PP, RP and LP, and SP and IP, respectively. Following this, the width to length (W/L), height to length (H/L), and height to width (H/W) ratios were computed. We automatically extracted tissue probability maps of white matter (WM), grey matter (GM), and cerebrospinal fluid (CSF) using the segmentation routine in SPM8.40 Whole brain volume was determined as the number of 1.0 mm3 isovoxels within which the sum of the three tissue probability maps was over 0.5.4142
Construction of KNE96 template
We constructed the KNE96 template, composed of high resolution 3D structural MR images from 96 Korean normal elderly subjects, using the DARTEL toolbox in SPM8.43 First, each of MRI scans was segmented using the segmentation routine in SPM8, and then the spatial transformation files derived from the segmentation routine was used to import the MRI scan into the rigidly transformed tissue probability maps of WM, GM and CSF. Following this, the tissue types were simultaneously registered (i.e., WM with WM, GM with GM, and CSF with CSF). The initial template is constructed as the mean of these 96 MRI images in the construction group. Deformations from this template to each of the individual images were computed and then the template was updated by applying the inverse deformations to the images and averaging the deformed images. This procedure was repeated based on multi-level pyramid approach, beginning with a more coarse registration then ending with the more detailed registration. After a total of 36 iterations, three probability maps of the KNE96 template were finally constructed. Finally, for T1 image of the KNE96 template, we warped individual T1 images using the flow fields that store deformation information and created the mean of the 96 warped T1 images.
In addition, we also constructed two gender-specific templates (KNE48M template for male and KNE48F template for female) by dividing the subjects in the construction group into two subgroups by gender and repeating the template construction process for 48 male subjects and 48 female subjects, respectively.
Validation of the KNE96 template
To validate the KNE96 template, we used a nonlinear version of the ICBM152 atlas (i.e., ICBM152 template) as a comparison template.1516 We compared the deformations that resulted from image registration using the KNE96 and ICBM 152 templates. Each MRI scan in the validation group was registered to both the KNE96 and ICBM152 templates using DARTEL.43 We used displacement vectors and Jacobian determinants to analyze the deformation of each subject to each template.44 For each voxel, the Euclidean distance between the subject and its deformed image was obtained as the magnitude of the displacement vector, d v →  . Furthermore, the Jacobian determinant is an indicator of volumetric change at each voxel under deformation. Its value is >1, 1, or <1 if there is volume expansion, preservation, or contraction, respectively. Therefore, we derived two kinds of maps for each test subject registered to each template: the magnitude of displacement vectors (i.e., mag-displacement) and log of Jacobian determinants (i.e., log-Jacobian).
. Furthermore, the Jacobian determinant is an indicator of volumetric change at each voxel under deformation. Its value is >1, 1, or <1 if there is volume expansion, preservation, or contraction, respectively. Therefore, we derived two kinds of maps for each test subject registered to each template: the magnitude of displacement vectors (i.e., mag-displacement) and log of Jacobian determinants (i.e., log-Jacobian).We analyzed the differences in the mag-displacement and log-Jacobian maps between the KNE96 and ICBM152 templates using voxel-based morphometry (VBM). Because the mag-displacement and log-Jacobian maps were generated in each template space that was used as the reference for registration, these maps were spatially normalized so that the coordinates were in MNI space, using the DARTEL toolbox.43 Comparison between the KNE96- and ICBM152-registered mag-displacement and log-Jacobian maps was performed with a paired-samples t-test for each voxel. With Bonferroni correction, p<6.9×10⁻⁹ was considered a statistically significant difference.
In addition to VBM analysis of the mag-displacement and log-Jacobian maps, to explore the region-specific differences between the KNE96 and ICBM152 templates, we determined the deformation for each anatomical region of the Talairach atlas.1145 First, voxels were classified into 1105 anatomical regions using the Talairach atlas. Second, for each Talairach region, the significant averaged differences (SADs) of the mag-displacement and the log-Jacobian were computed as follows:
with:
Here, xi represents the ith voxel in the mag-displacement and log-Jacobian maps and NRt represents the number of voxels that belong to the tth Talairach region, Rt. Sj and Ns=48 represent the jth subject and the number of subjects in the validation group, respectively. Significant voxel rates, Rmag-displacemen (Rt) and Rlog-jacobian (Rt), were defined as the ratio of the number of significant voxels from the paired-samples t-tests to the total number of voxels in the Talairach region, Rt.
RESULTS
Global brain features
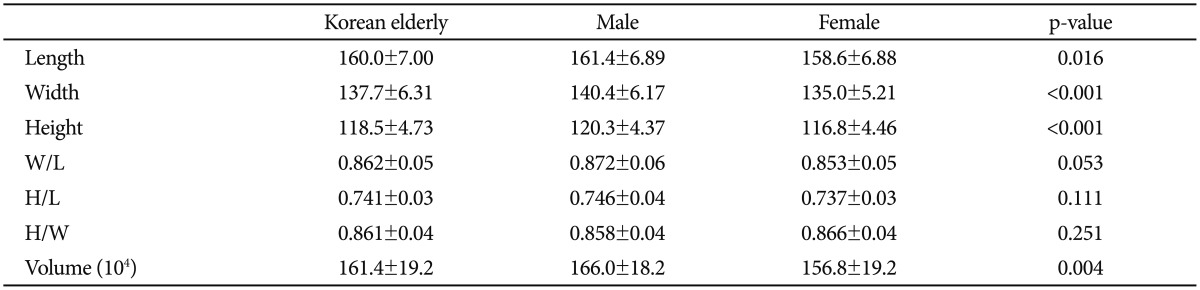
Figure 1 shows the KNE96, KNE48M, KNE48F, and IC BM152 templates. In Korean subjects, male brains were longer, wider, taller, and thus larger than the female brains. However, the ratios of W/L, H/L, and H/W were comparable between male and female brains (Table 2). The KNE96 template was shorter but wider than the ICBM152 template (Table 3), which was consistent with previous observations that report differences in global hemispheric shape and size between Occidental and Oriental brains.293046
Comparison of registration-induced image deformation between the KNE96 and ICBM152 templates
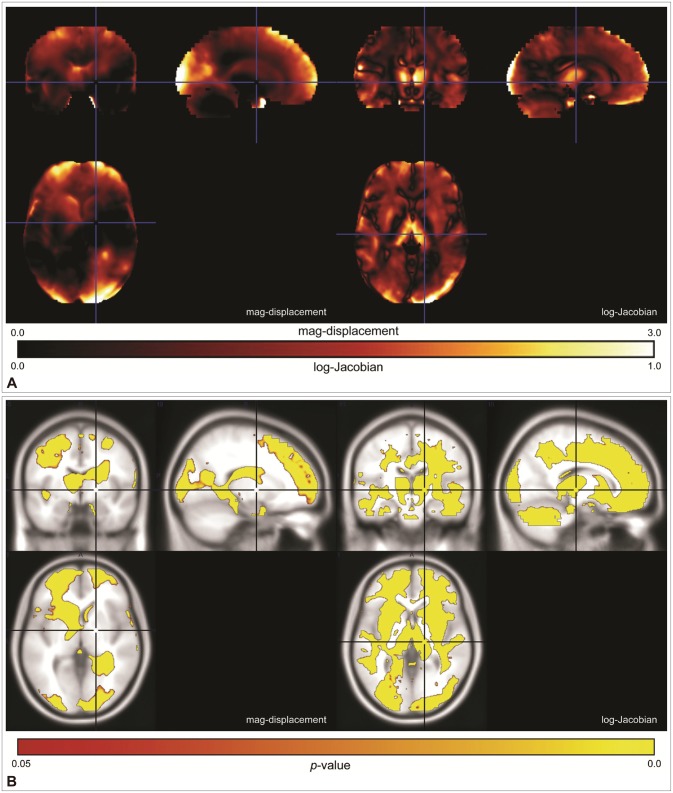
Figure 2 shows the differences in the mag-displacement and log-Jacobian maps between the KNE96 and ICBM152 templates. As shown in Figure 2A, we found that the mag-displacement and log-Jacobian induced by registration to the KNE96 template were much smaller than those induced by registration to the ICBM152 template in most brain regions. Figure 2B illustrates the significant voxels of the VBM analysis overlaid on corresponding standard T1 image. This indicated that there is less deformation and a lower risk of volumetric errors if KNE96 is used as the reference template in neuroimaging studies in the Korean elderly population.
Figure 3 shows the SAD maps of the mag-displacement and the log-Jacobian. The mag-displacement SAD map shows large values in some Talairach regions within the frontal and occipital lobes while the log-Jacobian SAD map shows large values in the frontal and occipital lobes, and the thalamus.
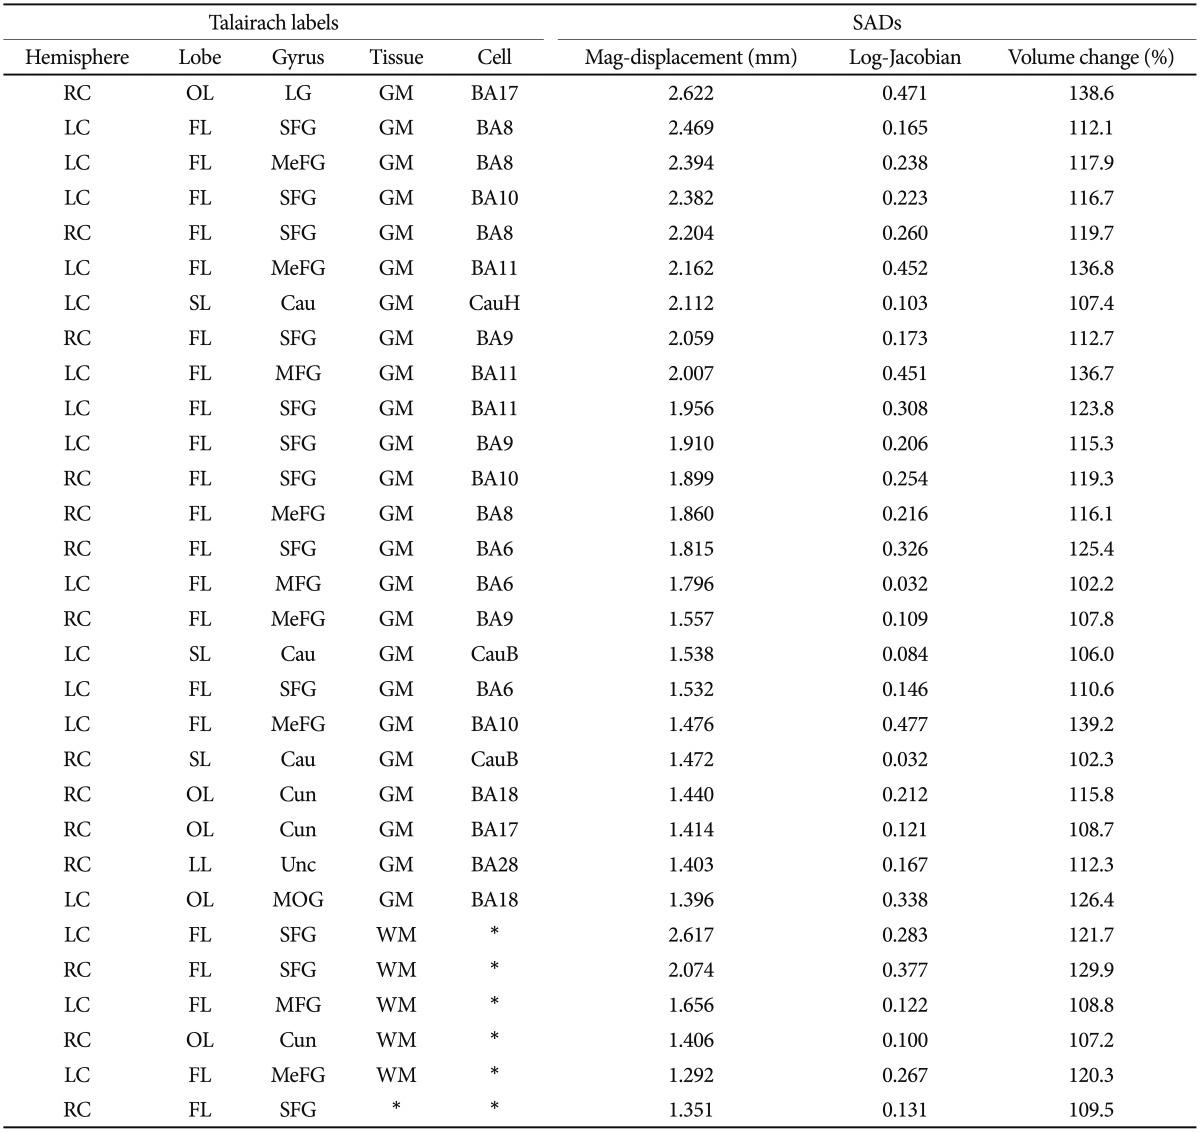
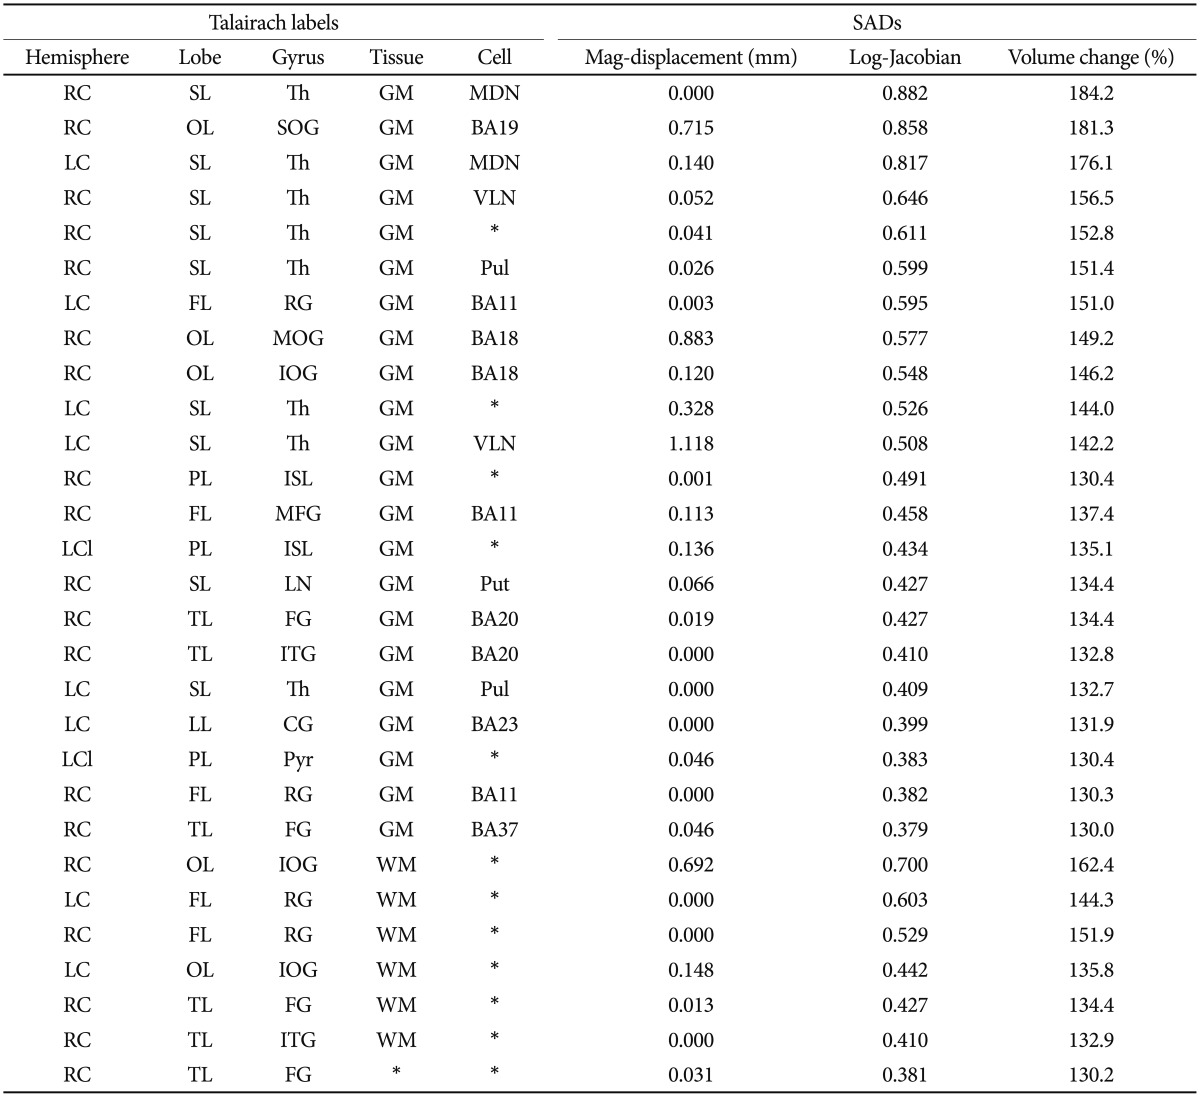
By considering each Talairach region as a data point, we constructed a two-dimensional scatter plot in which the y-axis is the mag-displacement SAD and the x-axis is the log-Jacobian SAD, as shown in Figure 4. Because we excluded small Talairach regions that had a volume less than 500 mm3, Figure 4 contains 355 data points. And then, we performed a two-step cluster analysis in PASW Statistics 18.0 (IBM SPSS Inc, 2009, Chicago, IL, USA) to partition these data points relative to their mag-displacement and log-Jacobian SAD values. Tables 4 and 5 list the Talairach regions with large mag-displacement and log-Jacobian SADs, respectively. Volume cha-nge indicates the ratio of the deformed volume using the ICBM152 template to that using the KNE96 template. The Talairach regions with large mag-displacement SAD values (circles in Figure 4) include the superior, medial, and middle frontal gyrus in the frontal lobe, lingual gyrus and cuneus in the occipital lobe, and caudate in the sub-lobar (Table 4). The Talairach regions with large log-Jacobian SAD values (boxes in Figure 4) include the thalamus in the sub-lobar, superior, middle, and inferior occipital gyrus in the occipital lobe, rectal gyrus in the frontal lobe, inferior semilunar lobule in the posterior lobe, and fusiform gyrus in the temporal lobe (Table 5). These regions may be subject to considerably larger changes in position or volume if the ICBM152 was used instead of the KNE96 as a reference template for neuroimaging studies in elderly Koreans.
DISCUSSION
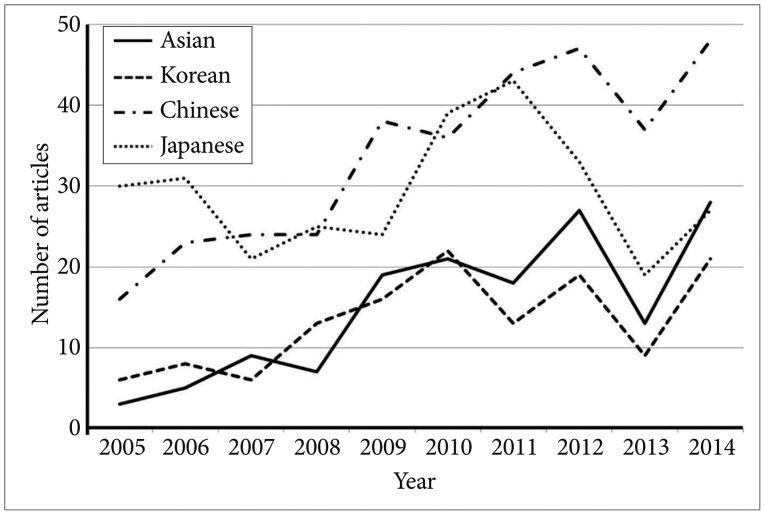
Although many volumetric brain MRI studies have been based on Caucasian populations, the number of studies using Asian brain MRI images is steadily rising. Figure 5 shows the number of articles containing the words 'brain', 'MRI', and either 'Asian', 'Korean', 'Chinese', or 'Japanese' published in NeuroImage for the period of 2005 to 2014. Thus, the construction and validation of a group-specific template using Asian subjects is a necessary alternative to the public atlases currently provided with many research tools.
In this study, we constructed a new Korean normal elderly brain template using high resolution 3.0T T1 structural MR images of 96 Korean elderly subjects (M/F=48/48) aged 60 years or older (M=69.5±6.2 years, F=70.1±7.0 years). We validated this template by comparing the magnitude of registration-induced deformation between the KNE96 and ICBM 152 templates using 48 Korean elderly subjects (M/F=24/24) aged 60 years or older (M=71.5±5.9 years, F=72.8±5.1 years). Although this study focused on the construction and validation of a Korean normal elderly brain template, it has demonstrated that further research into other phenotypic characteristics, such as gender and disease condition, should be taken into account for optimal and powerful analyses of regional brain morphometry.
In computational brain MRI studies, spatial normalization is necessary to compare structural changes between individual brains. During spatial normalization, brains are transformed to a standard template space, which intrinsically changes the position and local volume at every voxel in the image. In order to quantify the deformation, we used the magnitude of displacement vectors (i.e., mag-displacement) and the log of the Jacobian determinants (i.e., log-Jacobian). Using these two deformation measurements, we compared the image registration of Korean elderly brains to the KNE96 template and to the ICBM152 template. In particular, we explored region-specific differences in mag-displacement and log-Jacobian maps between the KNE96 template and the ICBM152 template. In this study, we have presented these region-specific differences for each anatomical region defined by the Talairach atlas1145 and reported the Talairach regions with large SAD values.
We found that regions in the frontal and occipital lobe, and thalamus show a large positional or local volume change when Korean elderly subjects were registered to the ICBM152 template compared to when registered to the KNE96 template. In addition, our measurements of the global brain features of Korean elderly subjects reflect previously reported differences in global shape and size between Occidental and Oriental brains.293046 Therefore, computational neuroimaging studies that measure, compare, and interpret the anatomical features of these regions in brains from Asian elderly populations using public atlases that are based on Caucasian populations, such as ICBM152 template, may have large measurement errors and thus false study results.
For example, we calculated the log-Jacobian SAD in the medial dorsal nucleus of the thalamus in the right cerebrum to be 0.88. This means that if Korean elderly subjects are registered to the ICBM152 template, this region might be 1.84 times larger when compared with registration to the KNE96 template. Some volumetric studies have reported bilateral thalamus volume reduction in Alzheimer's disease (AD) patients when compared with normal control subjects.474849505152 The thalamus is known to be involved in directing attention and suppressing irrelevant sensory inputs,53 in particular the medial dorsal nucleus is important for memory functions.54 However, in these studies, MRI images from Caucasian elderly subjects were transformed to the ICBM152 template and the thalamus was segmented. The use of the ICBM152 template as a reference atlas for Asian elderly subjects may substantially increase the risk of volumetric errors and therefore exaggerate or diminish thalamus volume reduction in AD patients. To investigate the consistency of the studies among different ethnic groups, it is important to use a population-specific template, such as the KNE96 template, for spatial normalization and segmentation of brain images from Asian populations.
Tables 4 and 5 show the asymmetry of deformation in the cuneus of the occipital lobe and fusiform gyrus of the temporal lobe. These regions have large mag-displacement or log-Jacobian SAD values in the right hemisphere, which are not present in the left hemisphere. Although the cause of this asymmetry is unclear, the results demonstrate that the right cuneus and fusiform gyrus had a greater positional or volumetric change when registered to the ICBM152 template than the left cuneus and fusiform gyrus. For example, in the fusiform gyrus of the temporal lobe, there was an approximately 130% volume change in the right hemisphere when compared with 115% volume change in the left hemisphere. Therefore, the use of the ICBM152 template as a reference atlas leads to unreliable results and the KNE96 template is strongly recommended in the Korean elderly population.
The KNE96 template was derived from 96 Korean normal elderly subjects, more than 60 years old, whereas the ICBM152 template was made base on 152 normal young age-Caucasian subjects. Therefore, unfortunately, the difference between the KNE96 template and the ICBM152 template includes not only the racial difference but also the age difference. In this study, we limited our scope to construct and validate the KNE96 template that would be fundamental for brain MRI studies about aging and geriatric of Korean elderly population, rather than to investigate the differences in brain structures from two groups having different age and race.
The KNE96, KNE48M, and KNE48F templates are available to download from http://recode.webnode.kr/news/kne-korean-normal-elderly-group-template/.