Structural MRI and Amyloid PET Imaging for Prediction of Conversion to Alzheimer's Disease in Patients with Mild Cognitive Impairment: A Meta-Analysis
Article information
Abstract
Objective
The aim of this study was to explore the prognostic values of biomarkers of neurodegeneration as measured by magnetic resonance imaging (MRI) and amyloid burden as measured by amyloid positron emission tomography (PET) in predicting conversion to Alzheimer's disease (AD) in patients with mild cognitive impairment (MCI).
Methods
PubMed and EMBASE databases were searched for structural MRI or amyloid PET imaging studies published between January 2000 and July 2014 that reported conversion to AD in patients with MCI. Means and standard deviations or individual numbers of biomarkers with positive or negative status at baseline and corresponding numbers of patients who had progressed to AD at follow-up were retrieved from each study. The effect size of each biomarker was expressed as Hedges's g.
Results
Twenty-four MRI studies and 8 amyloid PET imaging studies were retrieved. 674 of the 1741 participants (39%) developed AD. The effect size for predicting conversion to AD was 0.770 [95% confidence interval (CI) 0.607–0.934] for across MRI and 1.316 (95% CI 0.920–1.412) for amyloid PET imaging (p<0.001). The effect size was 1.256 (95% CI 0.902–1.609) for entorhinal cortex volume from MRI.
Conclusion
Our study suggests that volumetric MRI measurement may be useful for the early detection of AD.
INTRODUCTION
Alzheimer's disease (AD) has an insidious onset with a slowly progressive course. Mild cognitive impairment (MCI) is an intermediate stage between cognitively normal and AD. In particular, amnestic MCI is considered as a prodromal stage of AD. MCI may therefore be a target for the prediction of who will develop AD prediction. Several markers during the prodromal MCI stage, including neuropsychological tests, have been proposed for the prediction of AD. However, no single study has included enough data to provide a reliable predictor of AD.
The International Working Group (IWG) and National Institute on Aging Alzheimer's Association (NIA-AA) has proposed several biomarkers as diagnostic criteria for MCI, including cerebro spinal fluid (CSF) amyloid beta (Aβ) and tau, atrophy on MRI, glucose metabolism on [18F]-fluorodeoxyglucose positron emission tomography (FDG-PET) and fibrillar Aβ burden on amyloid PET.12
FDG-PET has been suggested to be the strongest predictor for progression from MCI to AD,3 however, its high costs may limit its widespread adoption. A CSF assessment requires a lumbar puncture, which is regarded an invasive procedure, although it is widely implemented without problems in the elderly. In contrast, MRI is noninvasive, widely used in clinical settings and also could be easily performed. Atrophy measurements on MRI have been used to predict the progression to AD inpatients with MCI since the 1990s. Most studies have analyzed the predictive value of hippocampus volume as well as the volume of entorhinal cortex and other regions. Furthermore, prediction of progression to AD in patients with MCI based on MRI may be effective for clinical trials of AD prevention. However, no meta-analysis exploring the effect size of MRI volume for the prediction of progression to AD has been conducted among patients with MCI applying qualified diagnostic criteria.
The aim of this meta-analysis was to explore the prognostic values of biomarkers of neurodegeneration as measured by MRI measurement and amyloid burden as measured by amyloid PET imaging in predicting progression to AD in patients with MCI.
METHODS
Search strategy
Studies published between January 2000 and July 2014 were identified through a computer-based search of PubMed and EMBASE by the OS X Server system of iMac. In addition, the PubMed option ‘Related Articles’ was used, and the references of identified studies were reviewed to search for potentially relevant papers. For structural MRI the search strategy was performed with the following search terms: (magnetic resonance imaging OR MRI) AND (mild cognitive impairment) AND (Alzheimer OR Alzheimer's disease) AND (predict* OR conversion or progress*). For amyloid PET imaging, the search strategy was performed with the following search terms: (positron emission tomography OR PET) AND (amyloid imaging OR beta-amyloid) AND (mild cognitive impairment) AND (Alzheimer OR Alzheimer's disease) AND (predict* OR conversion or progress*).
Selection criteria
Three reviewers (WYP, EHS and IHC) independently reviewed the abstracts and titles identified by the database searches and together decided on the articles to be retrieved. These retrieved articles were reviewed by all three authors to identify suitable studies. Discrepancies were resolved by reaching a consensus. Reviewers were not blinded to the study authors and results. Inclusion criteria for relevant research studies were the following: 1) reported in English, included original data and published in a peer-reviewed journal; 2) longitudinal design consisting of patients who could be classified as having progressive MCI (MCI-P: patients with MCI who progressed to a clinical diagnosis of AD) and stable MCI (MCI-S: patients with MCI who did not progress to AD); 3) diagnosis of MCI was made according to established criteria for MCI;45 4) clinical diagnosis of AD was performed according to the National Institute of Neurological and Communicative Disorders and Stroke and the Alzheimer's Disease and Related Disorders Association (NINCDS-ADRDA),6 and/or Diagnostic and Statistical Manual of Mental Disorders (DSM-IV);7 and 6) types of dementia other than AD were not present. In addition, if more than one study included an overlap in patient, then the largest and the most recent studies were included. If the criteria by which MCI was diagnosed were unavailable, the paper was included only after consensus from the three reviewers that the defined criteria were compatible with defined MCI criteria. The exclusion criteria were 1) studies in animals; 2) cross-sectional studies or clinical trials of medicine; 3) no or insufficient data; 4) reviews or symposium papers; 5) papers containing data that overlapped with another eligible study that was either larger or more recent; 6) progression status of MCI to AD was not provided.
Data extraction
The following information was extracted from the eligible papers: author names, year of publication, source of subjects, numbers of patients, age, sex, education, baseline Mini-Mental State Examination (MMSE), follow-up duration, region of interest for MRI imaging, radioisotope for amyloid PET imaging, and diagnostic criteria used for MCI and AD diagnoses.
Means and standard deviations or sensitivity and specificity values for patients with MCI-P and MCI-S at baseline were extracted by WYP and checked by IHC for each study. If a study fulfilled all inclusion criteria but did not report all relevant data, we contacted the authors to obtain supplementary data. Some authors did not respond to this request.
Quality assessment
Study quality was assessed independently by the same reviewers with the revised tool for the Quality Assessment of Diagnostic Accuracy Studies (QUADAS-2).8 Two blinded reviewers performed data extraction and QUADAS-2 scoring for each research study. A third reviewer served as a blinded expert in cases of disagreement.
Data analysis
The data were analyzed using Comprehensive Meta-Analysis software, version 2 (BiostatInc, USA). The measure of interest was the effect size Hedges's g, which is generally calculated as the difference between the group means divided by the pooled standard deviation. In the present analyses, Hedges's g was calculated as the standardized difference at baseline between patients with MCI-P and patients with MCI-S. When the data were reported as sensitivity and specificity, Hedges's g was calculated by the Comprehensive Meta-Analysis program (http://meta-analysis.com). The studies were tested for heterogeneity with the conventional Q-total tests and the H statistic.9
The potential for publication bias was investigated using visual assessment of the funnel plot calculated by the Comprehensive Meta-Analysis software. Publication bias may lead to asymmetrical funnel plots. The presence of publication bias was analyzed by graphical inspection of funnel plots and by fail-safe analysis (Rosenthal's method).
RESULTS
MCI conversion with Structural MRI
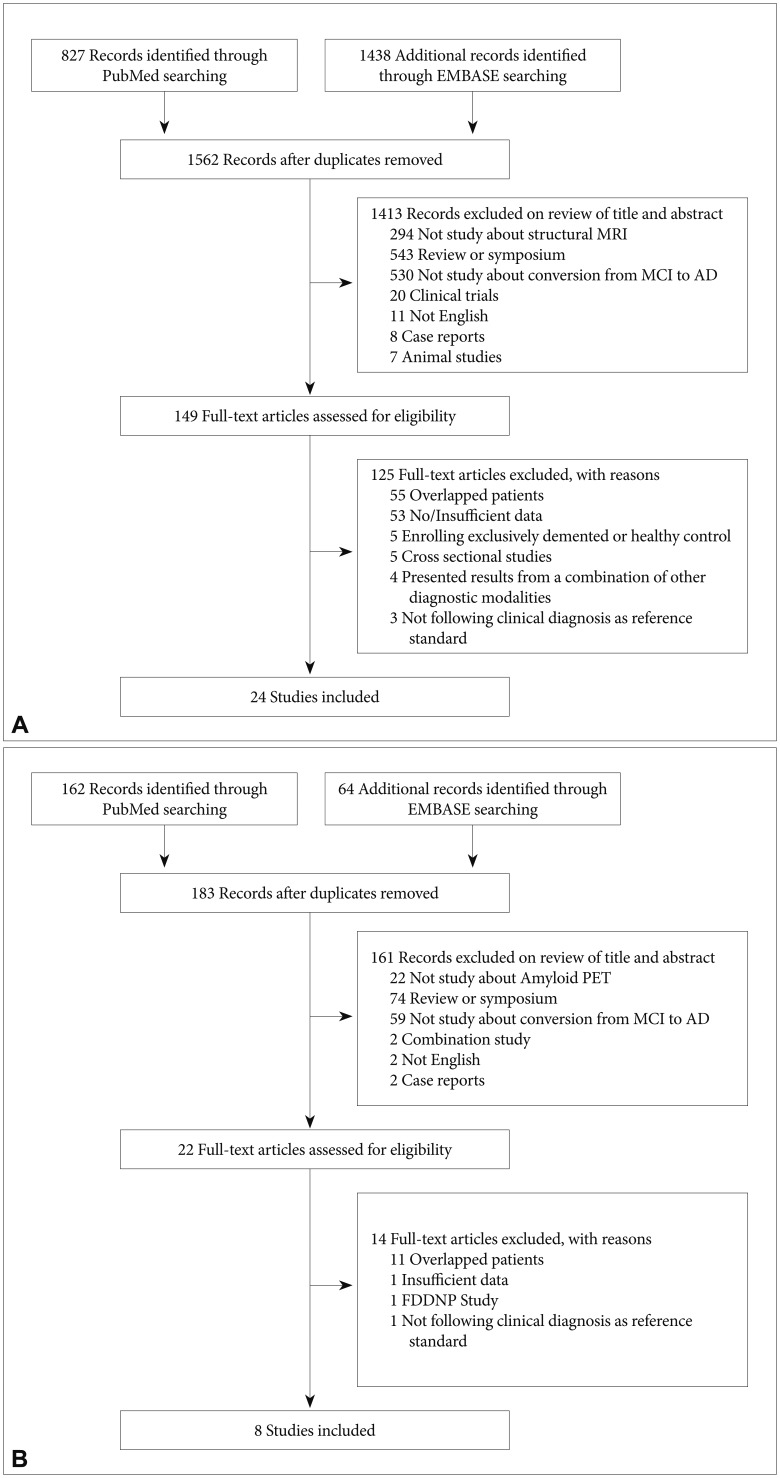
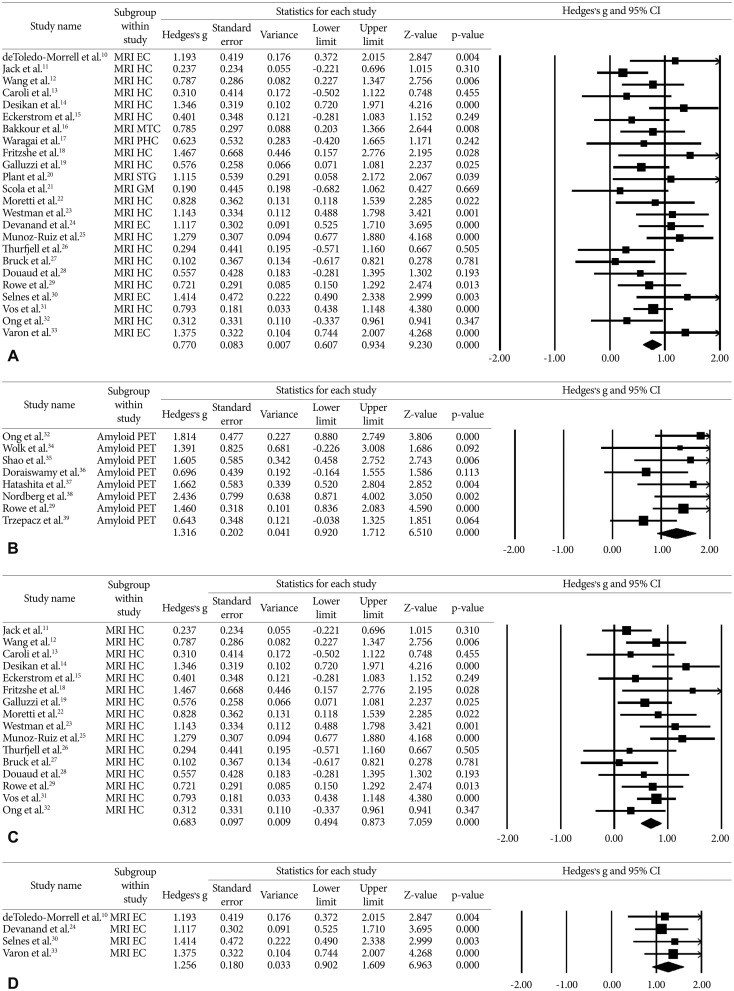
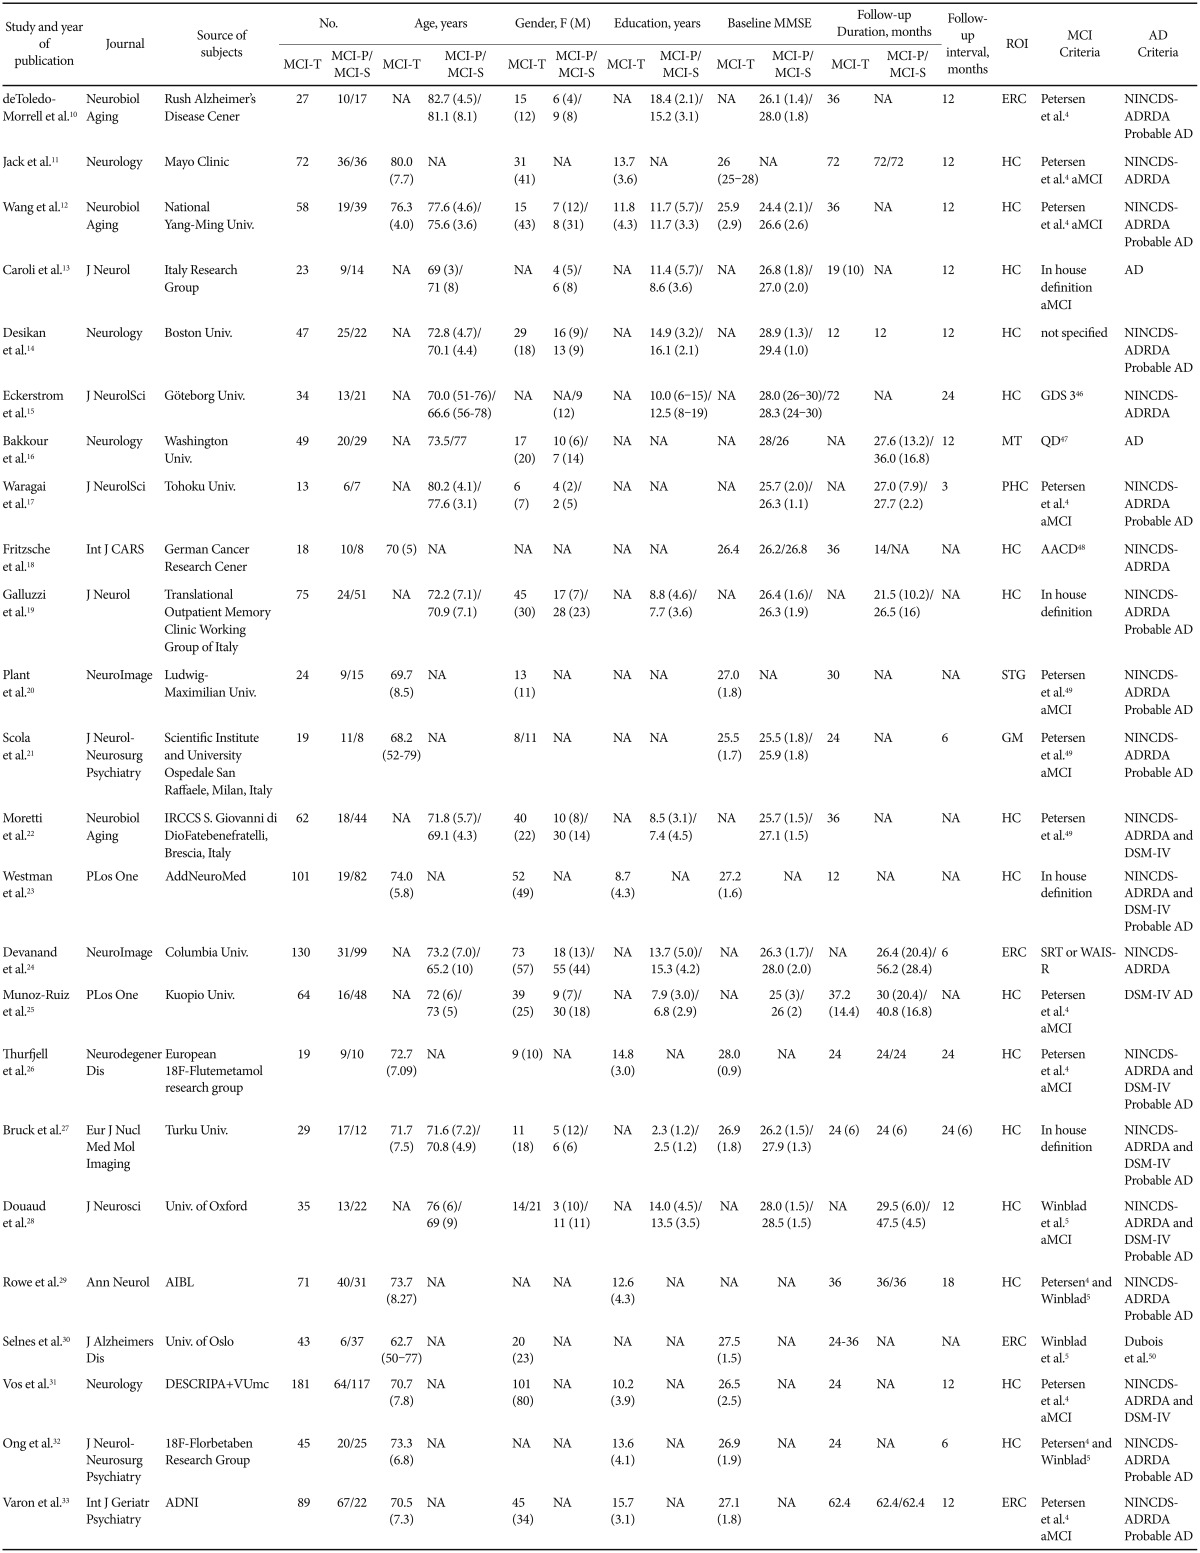
The search process is presented in Figure 1A. A total of 1562 MRI papers were initially identified from PubMed and EMBASE after the first round of screening based on titles and abstracts. Of these, 1413 papers were excluded after review of titles and abstracts for the following reasons: investigations did not use structural MRI (n=294), paper was a review or symposium (n=543), paper did not address conversion from MCI to AD (n=530), investigation was a clinical trials (n=20), paper was not published in English (n=11), paper described a case report (n=8) or investigation was in animals (n=7). We assessed 149 full-text articles for eligibility. Of these, 125 papers were excluded for the following reasons: patients overlapped with those in a large or more recent study (n=55), papers had no or insufficient data for meta-analysis (n=53), enrollment was limited exclusively to demented or healthy control (n=5), investigations used a cross-sectional design (n=5), investigations included results from a combination of other diagnostic modalities (n=4), and clinical diagnosis did not follow the reference standard (n=3). Twenty-four studies satisfied all inclusion and exclusion criteria (Table 1).101112131415161718192021222324252627282930313233 We selected a random-effects model to allow for both between- and within- study variation, which generates a more conservative result than a fixed-effects model. The weighted Hedges's g from the random effects models was 0.770 [95% confidence interval (CI) 0.607–0.934] across any volume of interest (VOI) MRI papers, 0.683 (95% CI 0.494–0.873) for MRI studies of the hippocampus and 1.256 (95% CI 0.902–1.609) for MRI studies of the entorhinal cortex (Figure 2A, C, D). A larger absolute value of the weighted Hedges's g indicates a stronger effect size between MCI-P and MCI-S, which means the risk with which MCI progress to AD by MRI measurement. Tests for heterogeneity were not significant (Q=32.685, p=0.087, I-squared=29.631 for total MRI; Q=21.712, p=0.116, I-squared=30.914 for hippocampus; Q=0.501, p=0.919, I-squared=0.000 for entorhinal cortex).

Flow diagram of participant selection for MCI conversion with structural MRI (A) and amyloid PET (B).

Hedges's g of progressive MCI versus stable MCI subjects with clinical follow up (A) Any VOI MRI measurement (B) Amyloid PET (C) Hippocampus volume measurement (D) entorhinal cortex volume measurement. The summary estimates were obtained using a random-effects model. The size of the data markers indicates the weight of the study, which is the inverse of the effect estimate. The diamond data markers indicate the pooled Hedges's g. PHC: parahippocampus cortex, HC: hippocampus, EC: entorhinal cortex, MTC: medial temporal cortex, STG: superior temporal gyrus, GM: gray matter of cerebrum.
MCI conversion with amyloid PET
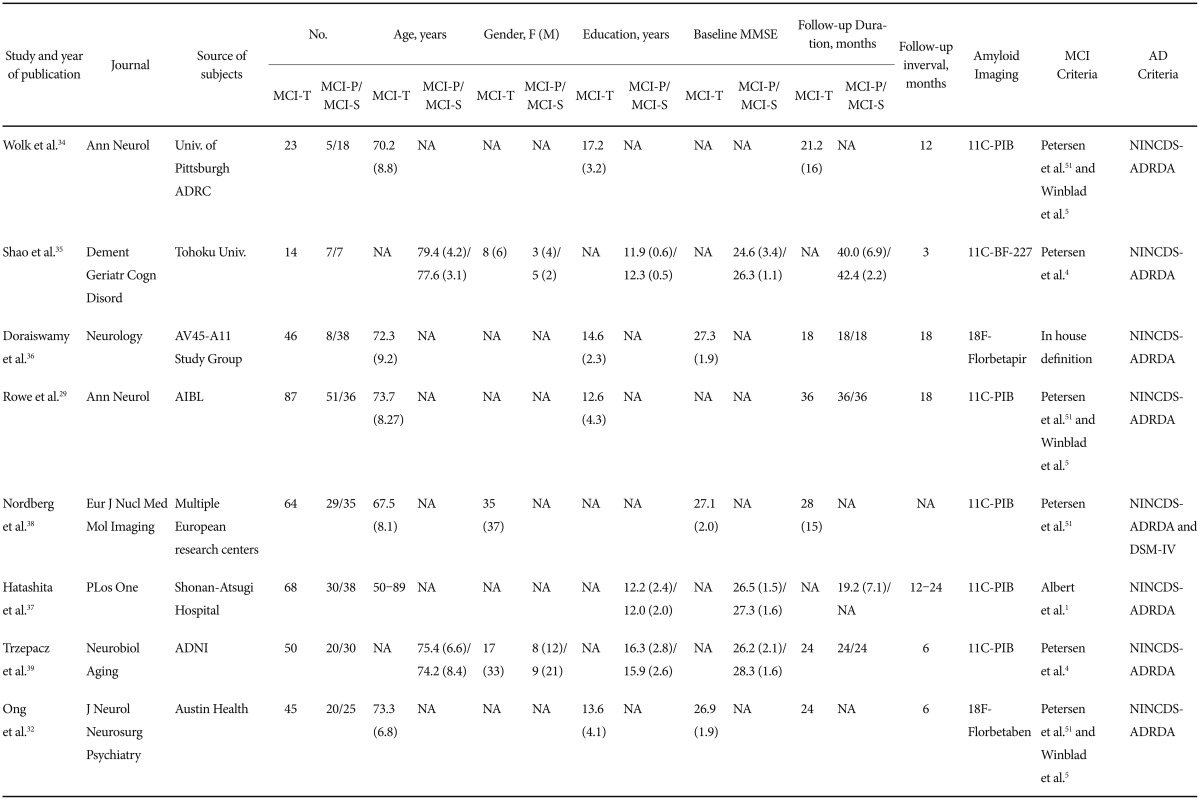
A total of 183 amyloid PET papers were initially identified from PubMed and EMBASE (Figure 1B). Of these, 161 papers were excluded after review of titles and abstracts for the following reasons: investigations did not use amyloid PET (n=22), paper was a review or symposium (n=74), investigation did not address conversion from MCI to AD (n=59), investigation was a clinical trials (n=20), investigations included results from a combination of other diagnostic modalities (n=2), papers were not reported in English papers (n=11) or paper described a case reports (n=2). We assessed full-text articles for eligibility. Of these, 14 papers were excluded for the following reasons: patients overlapped with those in a larger or more recent study (n=11), papers had no or insufficient data for meta-analysis (n=1), investigations used FDDNP-PET (n=1), and clinical diagnosis did not follow the reference standard (n=1). Eight studies satisfied all inclusion and exclusion criteria (Table 2).2932343536373839 Weighted Hedges's g from the random effects models was 1.316 (95% CI 0.920–1.712) (Figure 2B). Tests for heterogeneity were not significant (Q=9.554, p=0.215, I-squared=26.735).
Publication bias
There was no clear indication of publication bias. The funnel plots were not skewed (Supplementary Figure 1 in the online-only Data Supplement). Rosenthal's fail-safe numbers were 746 for the any VOI MRI group, 290 for the hippocampus, 120 for the amyloid PET group and 46 for the entorhinal cortex.
DISCUSSION
This study aimed to explore the ability of MRI atrophy measures and amyloid PET to predict conversion to AD in patients with MCI across a number of published studies. Effect size, which was expressed as Hedges's g between patients with MCI-P and patients with MCI-S, was highest for amyloid burden as measured by amyloid PET, followed by MRI atrophy measures in the entorhinal cortex, and in any VOI cortex, and the hippocampus. These results suggest that amyloid PET is overall a better predictor of progression to AD from MCI than MRI atrophy measures. However, the entorhinal cortex atrophy measure on MRI is comparable in prediction value to amyloid PET.
There are few previous meta-analyses on longitudinal studies that have validated the progression from MCI to AD. One previous meta-analysis reported that MRI atrophy measures had sensitivity of 72.8% and specificity of 81.0% for the prediction of conversion to AD.40 This meta-analysis included papers published only from 2000 to 2005 only, and a cognitively normal group was included in the baseline diagnostic criteria. In contrast, our study selected only patients with MCI as baseline diagnostic criteria and included papers over a broader range from 2000 to 2014. A meta-analysis by Zhang et al.,41 which included six paper on PIB-PET assessment from 2009 to 2011, reported pooled sensitivity of 93% and pooled specificity of 56% in the prediction of conversion to AD from MCI. Another recent PIB-PET meta-analysis, which included 8 papers published from 2009 to 2013, identified risk ratios for cognitive progression for cognitively normal, patients with MCI and patients with AD group.42 Relative risk from a fixed-effects model was 4.03 (95% CI 2.68–6.07) in patients with MCI. Only one paper in that meta-analysis (Nordberg et al.) overlaps with the papers included in our study. The findings from this previous meta-analysis cannot be compared with the findings of our current study.
Some studies evaluated two or more biomarkers for predicting progression from MCI to AD.31719272930313243 Two studies included in this meta-analysis assessed hippocampus volume by MRI and amyloid burden by PET in the same patients.2932 These studies reported higher odds ratios/positive predictive value/negative predictive value/accuracy for amyloid PET than MRI hippocampus volume reduction on MRI. Another European collaborative study predicted conversion to AD in patients with MCI using CSF Aβ42 concentration, cortical metabolism by FDG-PET, and MRI hippocampus atrophy.43 Their results suggested that progression to AD in patients with MCI increases with greater biological marker severity. Their recent consecutive publication for the NIA-AA and IWG diagnostic criteria reported that FDG-PET was the best individual predictor for progression to AD. However, the best predictive accuracy was achieved by a combination of amyloidosis and neurodegeneration biomarkers (CSF Aβ42 and FDG-PET or MRI hippocampus atrophy).3 These studies did not use amyloid PET and there may be some differences between amyloid PET and CSF Aβ42. Future studies should compare cerebral amyloid burden using both PET and CSF Aβ42 for AD prediction.
In terms of diagnostic criteria for MCI and AD, our study applied established criteria for MCI and NINCDS-ADRDA and/or DSM-IV criteria for AD. As indicated in Table 1 and Table 2, 9 studies did not meet proposed MCI criteria for structural MRI assessment131415161819232427 and two studies did not meet criteria for amyloid PET.3637 However, these papers were selected for analysis after the three authors reached the consensus that criteria used were compatible with suggested MCI criteria. Two papers did not indicate the criteria used to diagnosis AD1316 and one paper used IWG criteria.44 Some studies satisfied both NINCDS-ADRDA and DSM-IV criteria,22232627283138 and others used only one set of criteria. Some studies that used NINCDS-ADRDA criteria adopted probable AD,1012141719202123262728293233 whereas other studies did not indicate the diagnosis as probable or possible AD. Our study excluded other types of dementia, not AD.
One limitation of the current meta-analysis was the significant variability in the follow-up interval across studies. Therefore, we cannot exclude the fact that some of the patients with stable MCI may have later developed AD later on. However, results from a previous MRI study in which there was no difference in the duration of follow-up between patients with MCI-P and patients with MCI-S could clearly differentiate differences between the two groups.45 This study was not included in our meta-analysis.
The present meta-analysis has several strengths. First, compared with previous studies, we included patients with MCI who progressed to AD only and studies that applyed homogeneous diagnostic criteria for both MCI and AD. Second, we searched papers within a broad range of time from 2000 to 2014, which increased our sample size for meta-analysis of structural MRI assessments.
Our study also has several limitations. First, the clinical diagnosis of AD is not always correct; therefore, findings from studies with post-mortem confirmation of AD diagnosis are more convincing than those from studies with a clinical diagnosis of early-stage AD among patients with MCI. The studies included in this meta-analysisdid not confirm the clinical diagnosis of AD (or MCI) with neuropathological findings. Second, the follow-up duration was not consistent across studies. Third, patients with MCI were included in the meta-analysis irrespective of clinical phenotype (amnestic/non-amnestic), and patients with AD were included irrespective of probable/possible AD. Fourth, subgroup analysis for entorhinal cortex volume and amyloid PET analysis included a small number of studies. Fifth, different research groups used different modalities to assess the level of atrophy with MRI. These modalities include regional volume measures versus cortical thickness and manual volume tracing versus automatic volume tracing. Thresholds for abnormality also vary across laboratories, which increases the error variance in the assignment of normal versus abnormal.
As we know, the heterogeneity and underlying bias is inevitable in most meta-analyses, and may be present in our study. We may have overestimated the predictive accuracy of structural MRI and amyloid PET in the progression to AD form MCI because some studies included in the meta-analysis dichotomized scores according to the best cut-off in their study.
Our results suggest although amyloid PET is overall a better predictor of progression to AD from MCI than MRI atrophy measures, the entorhinal cortex atrophy measure on MRI is comparable in prediction value to amyloid PET. Data from this meta-analysiscould inform research on clinical applications of MRI volume measurements and be key to the development of guidelines and practice parameters for the use of AD biomarkers in the clinic.
Acknowledgments
This work was supported by research fund from a Basic Science Research Program through the National Research Foundation of Korea (NRF) funded by the Ministry of Education (2014R1A1A2054062) and the Brain Research Program through the NRF funded by the Ministry of Science, ICT & Future Planning (NRF-2014M3C7A1046041).
References
Supplementary Materials
The online-only Data Supplement is available with this article at https://doi.org/10.4306/pi.2017.14.2.205.
Supplementary Figure 1
Funnel plot of comparison between progressive MCI versus stable MCI participants (A) Any VOI MRI measurement (B) Amyloid PET (C) Hippocampus volume measurement (D) entorhinal cortex volume measurement.

