INTRODUCTION
Obstructive sleep apnea syndrome (OSAS) is a common sleep disorder affecting 3-7% of men and 2-5% women in the general population and obesity is a well-known risk factor for OSAS.1 However, the association between obesity and OSAS seems to vary across age groups. The few studies that have targeted elderly OSAS patients found that the effect of obesity on risk for OSAS was lower than that among those in other age groups.23 Similarly, the Sleep Heart Health Study reported a weak association between OSAS and obesity in individuals aged ≥70 yrs.4
Weight-based measurements, such as body mass index (BMI), have been widely used to assess obesity, but recent data have shown that regional body-fat distribution, such as central obesity, rather than BMI, is more strongly predictive of cardiovascular or metabolic complications.5 Similarly, OSAS studies have found that the predictive values of anthropometric measurements such as waist circumference (WC), neck circumference (NC), or waist-to-hip ratio (WHR) are more useful than BMI.678910 The importance of regional body-fat distribution can be understood in regard to the pathogenesis of OSAS, which is characterized by repeated upper-airway collapse during sleep. Fat accumulation around the upper airway may anatomically reduce the airway diameter, or fat deposits in the upper-airway muscle may increase susceptibility to collapse. These hypotheses are supported by numerous previous studies in which the superior predictive value of NC over other anthropometric measures, such as BMI, WC, or WHR,8910111213 was demonstrated with regard to OSAS. In addition, it has been posited that central obesity indirectly causes OSAS due to restricted thoracic volume, resulting in diminished airway caliber or obesity-related hypoventilation,14 thus explaining the association of increased WC or WHR with OSAS.6715 The male predominance of OSAS can also be interpreted, at least in part, by the different fat distributions between the genders. Compared to the upper fat distribution of males, the lower fat distribution of females is considered to be protective of OSAS,16 and this may contribute to the milder severity of OSAS in female patients despite their similar or even higher BMIs compared to males.417
More recent studies have analyzed body-fat composition by dual-energy X-ray absorptiometry (DEXA)318 or computed tomography19 to define the characteristic body-fat distribution associated with OSAS. However, DEXA has yet to be proven superior to anthropometric measures for OSAS.3 The interaction between age and obesity also needs to be clarified, but studies focusing on the elderly OSAS population are scarce, and direct comparisons with younger patients are limited.
In the present study, we assessed the effects of obesity on OSAS according to age. We also examined differences in regional anthropometric measurements such as BMI, NC, WC, and WHR to increase our understanding of the prevalence of OSAS across the age span.
METHODS
Subjects
We reviewed the medical records and nocturnal polysomnography (NPSG) results of patients diagnosed with OSAS at the Center for Sleep and Chronobiology of Seoul National University Hospital during 2007-2013. Inclusion criteria were >18 yrs of age, the availability of data on all anthropometric measurements (BMI, NC, WC, and WHR), and NPSG findings of an AHI >5/h and a sleep efficiency ≥40%. Data obtained from 1,110 patients (mean age, 52.7±13.6 yrs; females=311 or 28.0% of the total patients) were ultimately analyzed for the study. Patients were divided into six age groups for analysis: <30, 30-39, 40-49, 50-59, 60-69, and ≥70 yrs. This study has been approved by the Institutional Review Board of Seoul National University Hospital and have therefore been performed in accordance with the ethical standards laid down in the 1964 Declaration of Helsinki and its later amendments. Informed consent was obtained from all the participants in the study.
Anthropometric measurements
Data regarding BMI, NC, WC, and WHR were obtained from medical records at the visit for NPSG. BMI was calculated by dividing the weight in kilograms by the square of the height in meters (kg/m2). NC was measured at the level of the cricothyroid membrane (cm). WC was measured horizontally at the iliac crest top (cm), and hip circumference was measured horizontally at the level of the greater trochanter of the femur (cm) while standing. WHR was calculated by dividing WC by hip circumference.
Nocturnal polysomnography
NPSG was performed using Neuvou (Compumedics, Abbotsford, Australia) and included the following signals: three electroencephalogram channels, two submental electromyogram channels, two electrooculogram channels, one oronasal thermister, one nasal pressure transducer, thoracic and abdominal belts for respiratory effort, one tracheal microphone for snoring measurement, two electrocardiogram channels, two electromyogram channels on the anterior tibialis muscle, and a pulse oximeter attached to the finger to measure oxygen saturation. Sleep data were scored, primarily by trained sleep technologists and secondarily by sleep physicians, according to standard criteria.20 Apnea was defined as complete or near-complete (≥90%) cessation of airflow lasting ≥10 s. Hypopnea was defined as a reduction in the respiratory signal by >30% lasting ≥10 s that was associated with oxygen desaturation of ≥4%. The apnea-hypopnea index (AHI) was defined as the number of apneas and hypopneas per hour of sleep.
Statistical analyses
Statistical analyses were performed using Statistical Package for the Social Sciences (SPSS, Inc., Chicago, IL, USA) for Windows version 19.0. Subject characteristics are presented as means (SDs) unless otherwise specified. The Kolmogorov-Smirnov test was used to test for normality. The natural logarithm of AHI (lnAHI) was used to normalize the distribution of the originally skewed AHI data in all analyses. Pearson correlation analysis for the lnAHI with anthropometric measurements controlling for gender was performed for each age group. Stepwise multiple linear regression analysis for the lnAHI treating anthropometric measures and gender as covariates was performed for each age group. p<0.05 was considered significant.
RESULTS
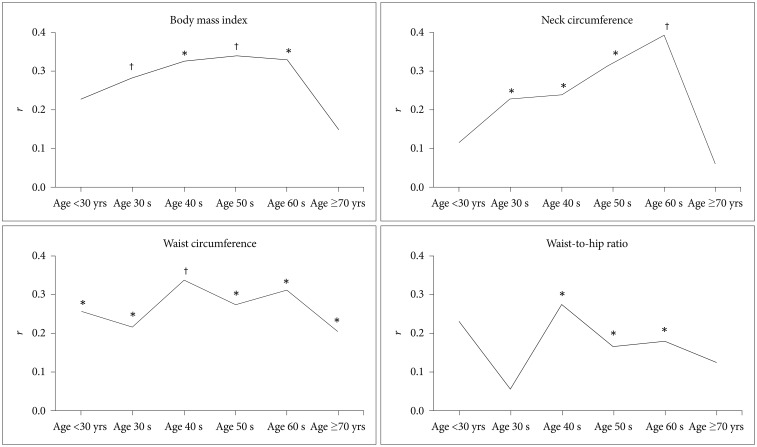
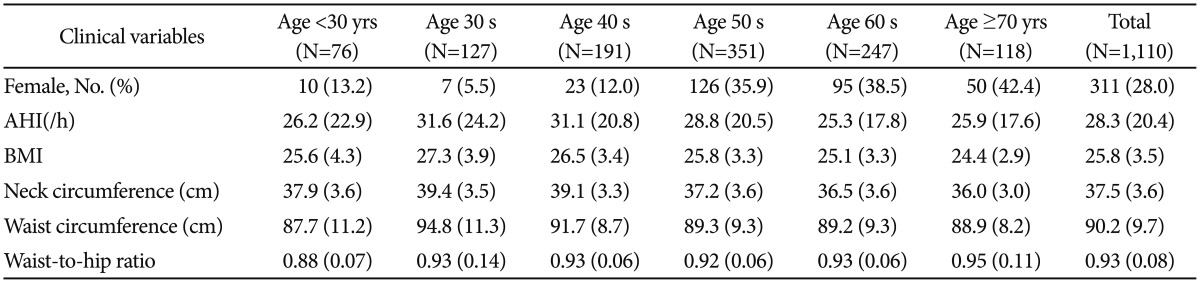
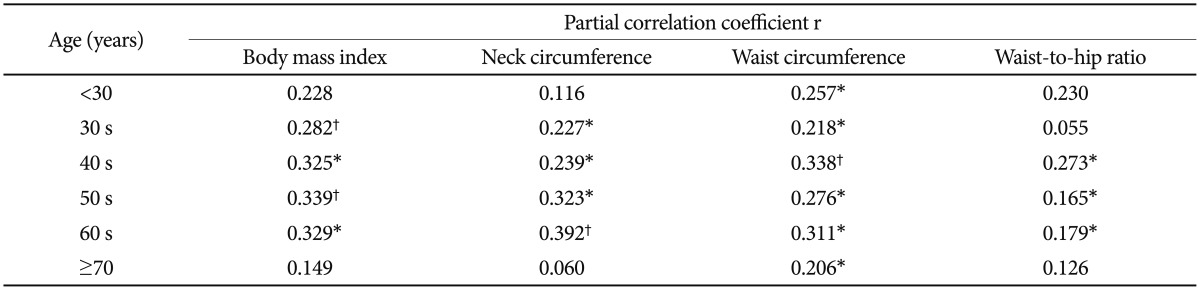
Table 1 presents the AHI and the anthropometric profile of all patients according to age. The prevalence of female patients increased with age. The partial correlation analysis between the lnAHI and each anthropometric measurement adjusted for gender revealed significant differences among age groups (Figure 1, Table 2). BMI was significantly correlated with the lnAHI among all age groups except those <30 and ≥70 yrs (Figure 1A). NC was also significantly correlated with the lnAHI in all age groups excluding those <30 and ≥70 yrs (Figure 1B). WC was significantly correlated with the lnAHI in all age groups (Figure 1C). WHR was significantly correlated with the lnAHI among those in their 40 s, 50 s, and 60 s (Figure 1D).
According to the multiple linear regression analysis for the lnAHI treating all four anthropometric measurements and gender as covariates, the final stepwise model accounted for an increasing percentage of the variability in the severity of OSAS among patients younger than 50 yrs; 7.0% (p=0.013), 9.1% (p<0.001), 14.5% (p<0.001), and 25.6% (p<0.001) for those <30 yrs, and those in their 30 s, 40 s, and 50 s, respectively. The final stepwise model accounted for a decreased percentage of the variability among those in their 60 s and those ≥70 yrs: 20.3% (p<0.001) and 3.9% (p=0.021), respectively (Table 3). In terms of anthropometric measurements, the remaining significant measurements were WC (p=0.013) for those aged <30 yrs, BMI (p=0.001) for those in their 30 s, WC (p<0.001) for those in their 40 s, NC (p<0.001), BMI (p=0.026) for those in their 50 s, NC (p<0.001) for those in their 60 s, and WC (p=0.021) for those aged ≥70 yrs (Table 4).
DISCUSSION
To the best of our knowledge, this is the first study to investigate the association between anthropometric measurements and the severity of OSAS as a function of age. Our results showed that obesity accounted for significant differences in the variability of the AHI according to age. Anthropometric measures accounted for significantly more variability in the AHIs of those in their 50 s and 60 s than in those of the youngest (<30 yrs) and oldest (≥70 yrs) groups. We also found significant differences involving the anthropometric measurements associated with regional fat distribution, which accounted for a significant amount of the variability severity of OSAS as a function of age. WC was significantly correlated with the severity of OSAS in all age groups, whereas BMI and NC were significantly correlated with it among all patients except those in the youngest and oldest age groups. However, the data regarding BMI and NC reflected different trends across age groups. The correlation between the severity of OSAS and NC linearly increased between 30 and 69 yrs of age, whereas that with BMI remained relatively stable.
In the model for the lnAHI with all anthropometric measurements included as covariates, both BMI and NC significantly predicted AHI among those in their 50 s, but NC was the only significant predictor among those in their 60 s. Our findings demonstrate the significantly different predictive values of NC compared to the relatively stable values of WC and BMI across the age span.
The reason for the age discrepancy in the effect of obesity, and specifically for the difference regarding regional obesity, has not been determined. Anatomical and functional changes in the upper airway according to age may play a role in this phenomenon. For example, craniofacial morphology or adenotonsillar hypertrophy, which are the major factors in pediatric OSAS,21 may have been more responsible for OSAS in our younger groups, whereas age-associated increases in upper-airway resistance,22 decreases in upper-airway muscle function,23 and unstable ventilator control24 may have contributed to our results for the elderly groups. These suggestions are consistent with the Sleep Heart Health Study in which data from 1,780 of a total of 5,615 participants aged ≥70 yrs showed only weak associations of BMI and anthropometric measures with the AHI. In addition, a 30 year follow-up study of anthropometric measures in 261 subjects aged ≥75 years found that WC and not NC was a significant predictor of the AHI, suggesting that the significance of NC demonstrated in other studies may not be valid in elderly individuals with OSAS.2
The few studies that have examined elderly individuals with OSAS have found that daytime sleepiness, snoring, and cardiovascular complications are less prevalent in this population than in middle-aged individuals with this condition.25 The different clinical manifestations combined with the weaker association with obesity have led researchers to consider whether OSAS in elderly individuals is distinct from that in middle-aged people. In this context, clinicians should be aware of the features that characterize OSAS in elderly individuals, such as neurocognitive impairments,26 nocturia,27 or falls, which are not routinely attributed to OSAS, and also consider that therapeutic weight loss may have less effect in this population. On the other hand, with regard to the rapid increase in the prevalence of obesity during the past decades and the long-term risk for OSAS,28 the older patients in our study may have been less obese during middle age and during the early stage of OSAS development. Thus, our cross-sectional approach to directly comparing middle-aged and elderly OSAS patients may have underestimated the effect of obesity among the elderly.29
This study has several limitations. First, anthropometric measurements do not directly assess regional body-fat distribution. However, studies that have compared the predictive power of DEXA body-fat distribution to that of anthropometric measurements have not confirmed the superiority of DEXA.3 Second, our patients were all Korean, and generalization to other ethnic groups may not be appropriate. However, despite the relatively low BMIs in Korean and Asian individuals with OSAS, previous studies have demonstrated that the increase in AHI according to BMI is similar to that in Caucasians.30
Based on our results, we suggest that obesity poses a greater risk for OSAS among middle-aged people than in younger or elderly individuals. In particular, NC was significantly more predictive of the severity of OSAS in middle-aged individuals. The differential contributions of the anthropometric measurements associated with regional fat distribution to severity of OSAS according to age suggest different pathogeneses, providing insight into the distinct clinical manifestations of and therapeutic modalities for OSAS across the lifespan.