INTRODUCTION
Positive affect (PA) and negative affect (NA) are the higher order dimensions that provide measures of emotional experience. Although their names might imply that they represent opposite poles of the same dimension, PA and NA are indicative of orthogonal dimensions of affective experience, with high-NA representing subjective distress and unpleasant engagement, and low-NA denoting calmness and serenity. On the other hand, PA is an expression of the extent to which individuals experience pleasurable engagement with the environment. Thus, emotions such as alertness and enthusiasm characterize high PA, while lethargy and sadness indicate low PA.1
Watson and Clark1 concluded that "in our own studies and in virtually all published self-report studies that we have subsequently reanalyzed, we have encountered the same two large, bipolar dimensions" p. 220. Also, Cacioppo and Gardner2 concluded that independent biological mechanisms appear to regulate experiences of PA and NA (probably because PA and NA had different roles in evolution), one indication of which would be differential predictors of PA and NA elicitation.
PA and NA have associations with the tripartite model.3 According to this model, anxiety and depression share NA as a common factor, whereas depression is specifically characterized by low levels of PA, and anxiety by physiological hyperarousal (PH). This model explains the frequent comorbidity of anxiety disorders and depressive disorders by suggesting that both disorders share the common dimension of NA.4 The tripartite model has gained broad and growing acceptance, in adult population,5 in a child clinical sample6 and in elderly sample.7
The Positive and Negative Affect Schedule (PANAS) is one of the most widely utilized measures of PA and NA, and was developed by Watson et al.8 PANAS is two by 10-item tools designed to assess PA and NA. Each of the items is rated from 1 (very slightly or not at all) to 5 (very much).
Although many studies have shown that PANAS has good psychometric properties, some problems remain. Watson et al.8 insisted that PA and NA are independent, but findings about associations between PA and NA are inconsistent. A previous study in Caucasians showed either zero9 or negative correlations8,10 between PA and NA, whereas a positive correlation between PA and NA was reported for the Japanese version of PANAS.11 Thus, it is possible that associations between PA and NA vary across countries according to the notion of cultural affect diversity.12
In addition, confirmatory factor analysis (CFA) findings of the two-factor model of PANAS have been contradictory, whereas exploratory factor analysis (EFA) results yielded a robust two-factor solution. Some studies have produced adequate fits to the data with the CFA of PANAS, whereas others have observed poor fit. Thus, it remains to be determined whether the CFA technique provides a clear replication of Watson et al.8's factor solution. Some researchers have examined the psychometric properties of PANAS in non-English speakers including Estonians,13 French,14 Germans,15 Japanese,11 Russians,16 Spanish,17 Swedish,18 Turkish,19 Italian,20 and Serbian.21
Recently, a Korean version of PANAS (K-PANAS)22 was developed, but it has some limitations. The first involved a translation problem which we found in the back-translation procedure. Lee et al.22 noted that the item, gi-min-han, which supposedly means "alert" has a meaning that is slightly different from the precise meaning of 'alert', i.e., 'are paying full attention to things around one'. We also found other problematic items, i.e., heung-mi-jin-jin-han (interested), heung-bun-doen (excited), dan-ho-han (determined), and ju-ui-gi-peun (attentive). Heung-mi-jin-jin-han is suitable for describing an object rather than an affect, whereas Heung-bun-doen can mean "agitated" or "excited". Dan-ho-han is suitable for describing a behavior rather than an affect, and has two different context-dependent meanings, i.e., "assertive" and "determined". Similarly, ju-ui-gi-peun has two meanings, i.e., "attentive" and "henhearted".
There is another problem in the study by Lee et al.22 concerning the factor analysis technique used. Four models of PANAS have been proposed: 1) an uni-dimensional model that loads all items onto one factor; 2) a multidimensional model composed of two interrelated factors (PA and NA); 3) a multidimensional model consisting of two independent factors (PA and NA); and 4) a hierarchical three-factor model composed of a single PA factor and NA as a second-order factor made up of two lower-order factor (PA, "upset", and "afraid").23 Lee et al.22 conducted factor analysis using the EFA, but this technique is unsuitable for comparisons with other models.
The third problem with Lee et al.22's study concerns sample selection. In this study, undergraduate and community samples were combined, and factor structures could differ across these populations, which reduce model fit to the data. In addition, the sample included only non-clinical subjects, and therefore, we should be cautious about applying these findings to other groups, especially to clinical populations.
Because of the limitations and inconsistencies of previous studies, our aims in the present study were to; 1) determine the factor structure of K-PANAS among Koreans, 2) investigate the psychometric properties of K-PANAS in a clinical group, 3) verify the correlation between PA and NA among Koreans, and 4) to test whether the relationships of PA and NA with anxiety and depression support the tripartite model. We hypothesized that the correlation between PA and anxiety would be lower than that between PA and depression, and that PA would account for significant unique variance to the prediction of depression.
METHODS
Participants
Participants included 218 treatment-seeking patients, and were aged between 18 and 71 years, and 63% were female [mean age=42.59 years, standard deviation (SD)=12.59]. Patients were recruited from psychiatric outpatients attending the Samsung Medical Center in Seoul. Diagnosis was made by a psychiatrist using an unstructured interview, and independently confirmed by a Master's-level psychologist using structured diagnostic interviews (the Structured Clinical Interview for the DSM-IV, SCID)24,25 under the supervision of a doctoral-level psychologist during most interviews. All participants provided written informed consent.
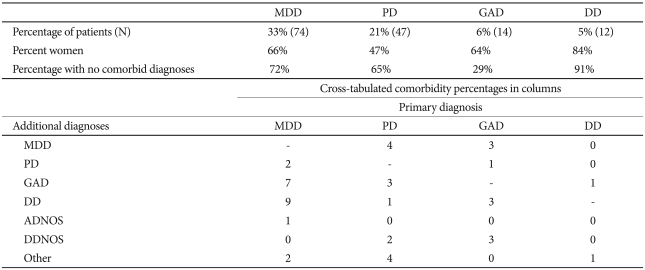
Primary DSM-IV diagnoses (i.e., the principal source of distress and the disorder for which the patient was seeking treatment) were as follows: major depressive disorder (n=74), dysthymic disorder (n=12), panic disorder (with or without agoraphobia: n=47), obsessive-compulsive disorder (n=4), post-traumatic stress disorder (n=4), generalized anxiety disorder (n=14), social phobia (n=4), specific phobia (n=3), anxiety disorder not otherwise specified (n=15), undifferentiated somatoform disorder (n=9), depressive disorder not otherwise specified (n=22), bipolar disorder not otherwise specified (n=1), and bipolar II disorder (n=9)(Table 1).
Measures
The Korean version of the Positive and Negative Affect Schedule
PANAS8 is a 20-item questionnaire that assesses mood. Each of the items is rated from 'very slightly or not at all' (coded as 1) to 'extremely' (coded as 5). In the present study, we instructed participants to rate the extent to which they experienced each emotion during the previous week. The internal consistency coefficient for PA is 0.87 and for NA is 0.91. The test-retest reliability for PA is 0.79 and for NA is 0.89 over one week.
The Korean version of the Beck Depression Inventory
Beck Depression Inventory (BDI)26 is a 21-item questionnaire that assesses the frequency of depressive symptoms over a 1-week period. In the present study, we administered the Korean version of the BDI (K-BDI),27 which has demonstrated good psychometric properties. The internal consistency coefficient of the K- BDI is 0.92,27 which is as high as that of the original BDI.26
The Korean version of the Beck Anxiety Inventory
Beck Anxiety Inventory (BAI)28 is a well-performing, 21-item self-administered questionnaire and was designed to assess the frequency of anxiety symptoms over a 1-week period. In the present study, we administered the Korean version of BAI (K-BAI),29,30 which has a Cronbach's coefficient of 0.9329 with a test-retest reliability of 0.84.29
Procedure
Diagnostic interviews using SCID were completed before treatment. Information from the self-administered questionnaires was not used for diagnostic purposes. The participants completed the self-administered questionnaires before treatment initiation in most cases.
Data analyses
Prior to analysis, data were evaluated for possible violations of normality assumptions using the Kolomogorov-Smirnov Test. The results obtained indicated that several of the variables violated normal distribution assumptions (e.g., for K-PANAS item 5, skewness=2.83 and kurtosis=8.80). Nonnormality of some indicators made the authors conduct the latent variable analyses using robust maximum likelihood (MLM) in Mplus 2.02.31
Assessment of model fit
The goodness of fit of the CFA models was examined using the Tucker-Lewis Index (TLI),32 the Comparative Fit Index (CFI),33 and the Root Mean Square Error of Approximation (RMSEA).34 An acceptable model fit was defined by the following criteria: TLI (Ōēź0.90), CFI (Ōēź0.90), and RMSEA (Ōēż0.08). Each fit index utilized in the current study has a different rationale and reflects different aspects of fit.35
In addition, to evaluate the internal consistency reliability of the K-PANAS subscales, we used Cronbach's alpha, item-total correlations exceeding the minimum acceptable value of 0.70, and item-total correlations, with alpha thresholds of >0.30.36 Finally, to examine the relationship of the PA and NA with the measures of depression and anxiety, we used Spearman Žü correlations.
RESULTS
Reliability and item-level analyses
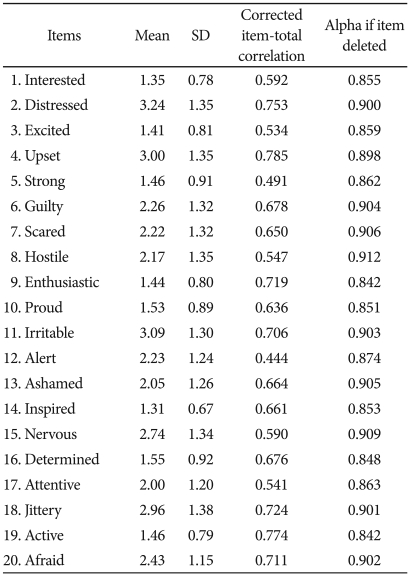
The mean NA total score was 26.67 (SD=10.01), which is lower than the mean scores obtained by Jolly et al.37,38 for predominantly Caucasian clinical samples (M=30.4, SD=10.0; M=30.5, SD=10.0)(Cohen's d=0.37; Cohen's d=0.38). NA total scores for women (M 26.31, SD=9.82) were similar to those for men (M=27.27, SD=10.38)(t-test, p=0.44)(Cohen's d=0.09). The mean PA total score was 15.76 (SD=6.20), which again is lower than the mean scores obtained by Jolly et al.37,38 for predominantly Caucasian clinical samples (M=23.8, SD=9.4; M=23.9, SD=9.4)(Cohen's d=1.00; Cohen's d=1.02). However, PA total scores for women (M=15.04, SD=5.34) were lower than those for men (M=17.00, SD=7.34)(t-test, p<0.01)(Cohen's d=0.30). Moreover, this gender difference in PA is inconsistent with results obtained using European American population.8 However, Crawford and Henry10 using United Kingdom samples, found gender differences for PA that were similar to those found in the present study. The test-retest reliability for the NA scale is 0.89 and for the PA scale is 0.79 over one week. Internal consistency tests gave a Cronbach alpha of 0.91 for the NA scale and 0.87 for the PA scale. Based on the criterion of Nunnally and Bernstein36 for an acceptable corrected item-total correlation, all items performed well (range=0.44-0.79)(Table 2).
Confirmatory factor analysis
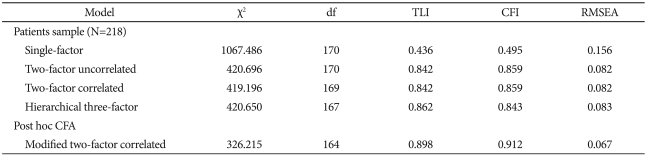
We designed three models for comparison by CFA, i.e., a single factor model (Model I); a two orthogonal factors model (Model II); a two correlated factors model (Model III); and a hierarchical three-factor model (Model IV). These models were found to be a poor fit (Table 3).
Post-hoc confirmatory factor analysis
Given the inadequate fit to the constructed models, some model modifications may be called for. Error terms from items theoretically determined to share substantial item content were allowed to intercorrelate, with the assumption that the items of the correlated error variances were conceptually similar.36 Items 6 (guilty) and 13 (ashamed), 7 (scared) and 20 (afraid), 17 (attentive) and 12 (alert), 1 (interested) and 3 (excited), and 14 (inspired) and 5 (strong), were allowed to intercorrelate in the present study, owing to the similarity of their item content. These items also satisfied the criteria for determining sources of model misfit: the modification indices, which were greater than the critical value for p<0.05. The model indicated good fit (Žć2=326.22; CFI=0.91; TLI=0.90; RMSEA=0.07, see Table 4 for factor loadings).
Concurrent validity
To verify the relationship between PA and NA and anxiety and depression, correlation analysis was performed using Spearman's method (Table 5). Since some of the variables failed to meet the normal distribution assumption according to Kolomogorov-Smirnov test, Spearman's coefficients were adopted. Consistent with expectation, NA was found to be significantly correlated with both anxiety and depression scales. Correlation analyses displayed a weak positive association between PA and anxiety and a weak negative association between PA and depression, though these findings are not statistically significant after applying the Bonferroni correction.
Regression analyses
Separate hierarchical regression analyses were conducted, predicting scores on the K-BDI and the K-BAI. During each analysis, NA was entered in the first step and PA was added in the second step. We also conducted regression analyses with the order of entry of K-PANAS factors reversed.
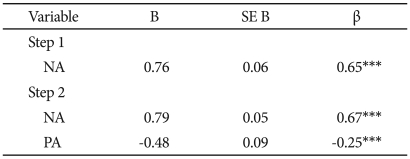
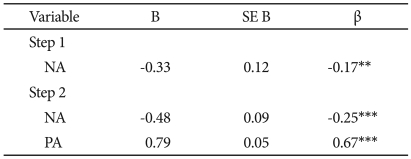
NA was entered in the first step of the regression equation predicting K-BDI and was significant, t(216)=12.56, p<0.001. PA accounted for significant additional variance in K-BDI, beyond that accounted for by NA, when it was entered on the second step, t(215)=-5.14, p<0.001, and NA was still significant, t(215)=13.78, p<0.001 (Table 6).
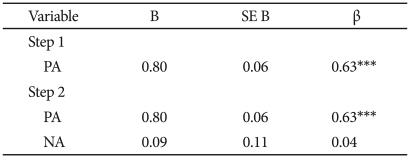
PA was entered in the first step of the regression equation predicting K-BDI and was significant, t(216)=-2.62, p<0.01. NA accounted for significant additional variance in K-BDI, beyond that accounted for by PA, when it was entered on the second step, t(215)=13.78, p 0.001, and PA was still significant, t(215)=-5.14, p<0.001. In the final model, NA and PA accounted for 48.6% of the variance in K-BDI, F(2, 215)=101.50, p<0.001 (Table 7).
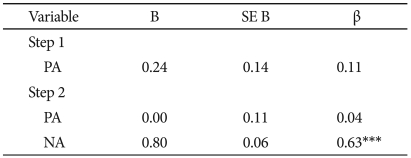
NA was entered in the first step of the regression equation predicting K-BAI and was significant, t(216)=12.15, p<0.001. PA accounted for no significant additional variance in K-BAI, beyond that accounted for by NA, when it was entered on the second step, t(215)=0.84, p>0.39, and NA was still significant, t(215)=11.97, p<0.001 (Table 8).
PA was entered in the first step of the regression equation predicting K-BAI and was not significant, t(216)=1.72, p>0.08. NA accounted for significant additional variance in K-BAI, beyond that accounted for by PA, when it was entered on the second step, t(215)=11.97, p<0.001, and PA was still not significant, t(215)=0.84, p>0.39. In the final model, NA and PA accounted for 40.8% of the variance in K-BAI, F(2,215)=74.15, p<0.001 (Table 9).
DISCUSSION
Our findings can be summarized as follows. 1) The reliability of the Korean version of PANAS is satisfactory. 2) The constructed models yielded an unacceptable fit for the data set. Results from our CFAs showed that neither model provided a good fit for the data. One possible explanation for the poor fit of the CFA models might be cultural differences. Thus, it is recognized that further refinements could be made by removing several items with insufficient loadings from each domain. However, it may be premature to do this, since further study with larger and more diverse samples might produce different results. 3) The modified model indicated good fit. 4) Moderate correlations between NA and the K-BAI and K-BDI provided strong evidence for convergent validity. However, contrary to prediction, the analysis showed a weak negative correlation between PA and the K-BDI and a weak positive correlation between PA and the K-BAI, which are at odds with the findings of a previous study,38 which showed that NA correlated highly with the BDI (r=0.76) and the BAI (r=0.79), PA correlated moderately with the BAI (r=-0.38), and PA correlated highly with the BDI (r=-0.61). The weak association between depression and PA, found in the present study, contrasted with the significant and moderate association found by Jolly et al.38 between the BDI and PA in their clinical sample. It appears that Koreans and Japanese do not to express their positive feelings freely, which restricts the PA score range, and thereby, may have attenuated associations with the K-BDI. The fact that the standard deviation of PA was smaller in our sample than in Jolly et al.38's sample (SD's=6.2 vs. 9.4) supports this explanation. 5) The regression analysis showed that variance unique to depression is predicted by PA. These findings are generally consistent with the tripartite model and suggest the usefulness of PA for differentiating depression and anxiety. 6) The association between PA and NA was positive, though weak, which is consistent with finding in the Japanese sample, but is contrary to results in Caucasians. Thus, finding could reflect differences between Asians and Caucasians in terms of the relationship between PA and NA.
Small but significant positive correlations between PA and NA are explained by the fact that the measure in this study assessed state PA and NA rather than trait PA and NA. Previous studies showed that while PA and NA were independent of each other on the trait level, the associations between PA and NA were significant on the state level.39 These results suggest that whereas occasion-specific components of the PA and NA scales are positively correlated in the present analyses, the relation between the dispositional components of PA and NA could be different in the future study.
This study has four limitations. First, only self-reported mea-sures were included, and thus, relationships between variables may have been affected by questionnaire-specific method variance. Second, the sample size was inadequate. According to Guadagnoli and Velicer,40 stability problems occur when sample sizes are small (n=50 to 300), and thus, the size of our patient sample (n=218) may have been insufficient to obtain a stable lower-order factor solution. Thus, factor analyses should be replicated with larger samples. Third, although the model modifications needed to yield a sufficient fit to the data were both conceptually and statistically upheld, cautious interpretation of these results is needed. Many methodologists have been criticized post hoc modifications which rely on chance, thus prevent the generalization of the findings.41 Finally, we did not assess the inter-rater agreement for the diagnoses which could have affected our results. Thus, additional analyses should be conducted to calculate the agreement coefficient.
K-PANAS seems to be a promising tool for assessing PA and NA, but would probably benefit from further refinement. Although our post-hoc CFA supported a two-factor solution, this does not imply that it does not require further confirmation. Because the hypothetical models did not adequately fit the sample, further study of this instrument is required to identify the best fitting model.42