INTRODUCTION
Adjustment disorder (ADJ) is a common diagnosis, particularly in primary care and general medical settings. ADJ has been diagnosed in up to 35% of patients who are referred to a mental health consultation, and in 5-20% of those in psychiatric health outpatient settings.1,2 Diagnosis of ADJ was more frequent than diagnosis of major depression in patients seen in a general hospital.3 However, there has been relatively little research done on this disorder.
While the concept of ADJ has evolved from Diagnostic and Statistical Manual for Mental Disorders (DSM)-I to DSM-IV-text revision (TR), criticism for the validity of the diagnosis of ADJ has always existed.4-6 ADJ, as a kind of subthreshold disorder, is poorly defined and overlaps with other diagnostic categories. Both the DSM-IV1 and the International Classification of Diseases (ICD)-107 attempt to overcome this problem by specifying that if the criteria for another disorder are met, then the diagnosis of ADJ should not be made. However, it is difficult for clinicians to discriminate ADJ from other major Axis I disorders because depressive symptoms are most prominent in patients with ADJ. Content validity studies show that patients with ADJ are not distinguished from patients with major depression.8,9
There have been efforts to delineate features that are unique to ADJ as compared to major depression, suggesting descriptive validity. Patients diagnosed with ADJ have a lower severity of illness rating, a greater likelihood of improving in the hospital, a greater severity of stressors, better recent functioning and a greater likelihood of being rated as improved at follow-up.3,5,10 These studies have focused almost exclusively on the course of the disorder. Studies based on pathophysiologic differences that find ADJ to be a specific psychiatric disorder are rare in comparison with major depressive disorder (MDD).
The purpose of this study was to elucidate the distinguishing neurophysiologic findings between ADJ and MDD using the electroencephalogram (EEG). The quantitative analysis of EEG (QEEG) variables, with appropriate statistical methods, offer objective and reliable mechanisms for evaluating and extracting diagnostic and discriminating EEG variables.6,11 Despite several methodological limitations, QEEG variables have been used to investigate brain activity in psychiatricdisorders.12,13 Relationships between psychiatric diagnostic categories and some QEEG variables have been examined in the attempt to characterize the QEEG abnormalities specific to a particular diagnosis.12,14 We hypothesized that there would be significant differences in QEEG absolute and relative power and coherence at the frontocentral area between patients with ADJ with depressed mood (ADJ group) and patients with MDD (MDD group) according to their different clinical characteristics. QEEG parameters at frontocentral area possibly reflect the circuitry dysfunction related to the fronto-limbic area known to be associated with mood regulation.
METHODS
Subjects
The subjects of this study were 30 patients with ADJ with depressed mood and 51 patients with MDD. All subjects were recruited from the outpatient department of Korea University Ansan Hospital. The patients were diagnosed through semi-structured clinical interviews based on the DSM-IV by three neuropsychiatrist. They were all drug-naïve. The study protocol was approved by the Ethics Committee of Korea University Medical Center.
EEG recording
All EEG examinations were performed by the same technician. During the recording, the subjects lay in a semi-darkened, electrically shielded, sound-attenuated room with their eyes closed in a maximally alert state. The technicians monitored the EEG data during the recording and re-alerted the subjects every 30 seconds to avoid drowsiness. The EEG was recorded from Fp1, Fp2, F3, F4, C3, C4, P3, P4, O1, O2, F7, F8, T3, T4, T5, T6, Fz, Cz, and Pz sites according to the international 10/20 system with a linked mastoid reference.
EEG data processing
Artifact removal was performed off-line by an experienced physician using Neuroguide 2.3.5 software (Applied Neuroscience, Inc., St. Petersburg, FL, USA). EEG data were re-edited by visual inspection of any artifact that was undetected by the software's artifact rejection toolbox. We selected 30 artifact-free epochs of 2-second durations. The total duration of these epochs was 60 seconds. The time/amplitude series had a sampling frequency of 256 Hz. Each digitized epoch of eye-closed EEG data was quantified using a fast Fourier transform15 algorithm to calculate absolute power (┬ĄV2) and relative power (%) in delta (1-4 Hz), theta (4-8 Hz), alpha (8-12 Hz), beta (12-25 Hz) and high-beta (25-30 Hz) bands. Measures of interhemispheric coherence for each band were also computed for eight homologous sites (Fp1-Fp2, F7-F8, F3-F4, C3-C4, P3-P4, O1-O2, T3-T4, T5-T6), and an additional set of sixteen electrode site pairs (Fp1-F3, F3-C3, C3-P3, P3-O1, Fp1-F7, F7-T3, T3-T5, T5-O1, Fp2-F4, F4-C4, C4-P4, P4-O2, Fp2-F8, F8-T4, T4-T6, T6-O2) was used to derive measures of intrahemispheric coherence for each band.
Statistical analysis
The clinical and demographic characteristics of both groups were analyzed by independent t test and Žć squared test using SPSS 12.0 software (SPSS Inc., Chicago, IL, USA). Between groups, resting, eyes-closed measures of power and coherence were assessed by independent t-tests using the NeuroStat (Applied Neuroscience, Inc., St. Petersburg, FL, USA). All analyses were carried out separately for each of the frequency bands. Significance was set at p<0.05.
RESULTS
Sociodemographic data
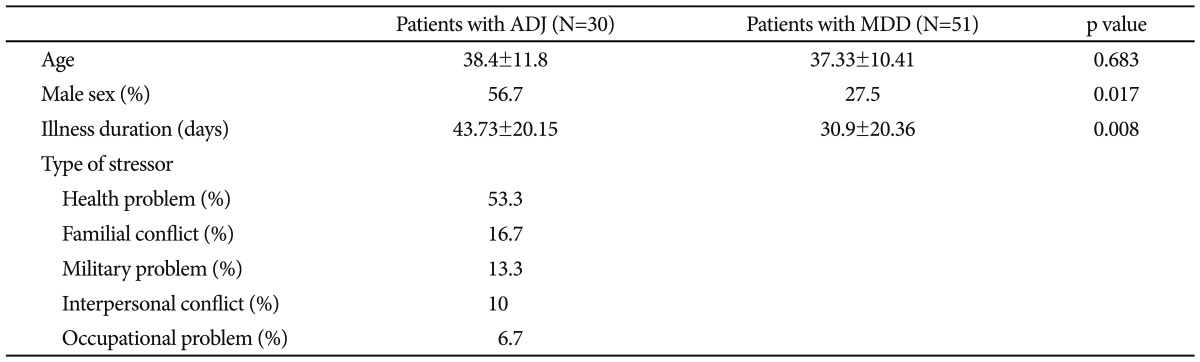
As shown in Table 1, the mean ages of the ADJ group and the MDD group were 38.4┬▒11.8 years and 37.33┬▒10.41 years, respectively. The mean age was not significantly different between the two groups (p=0.683). The percentage of male subjects (n=17, 56.7%) were greater in the ADJ group than in the MDD group (n=14, 27.5%; p=0.017). In the ADJ group, health problems (53.3%) were the most common type of predisposing stressor, followed by familial conflict (16.7%), military problems (13.3%), interpersonal problems (10%) and occupational problems (6.7%), in order. All subjects were right-handed.
Absolute and relative power
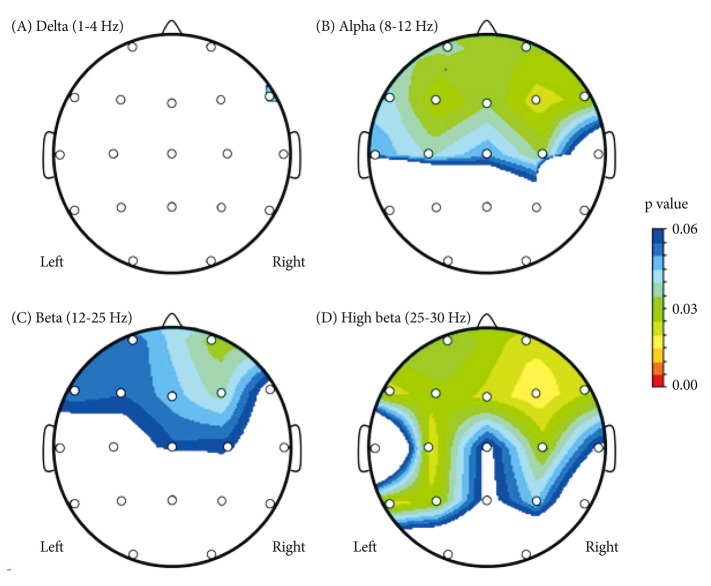
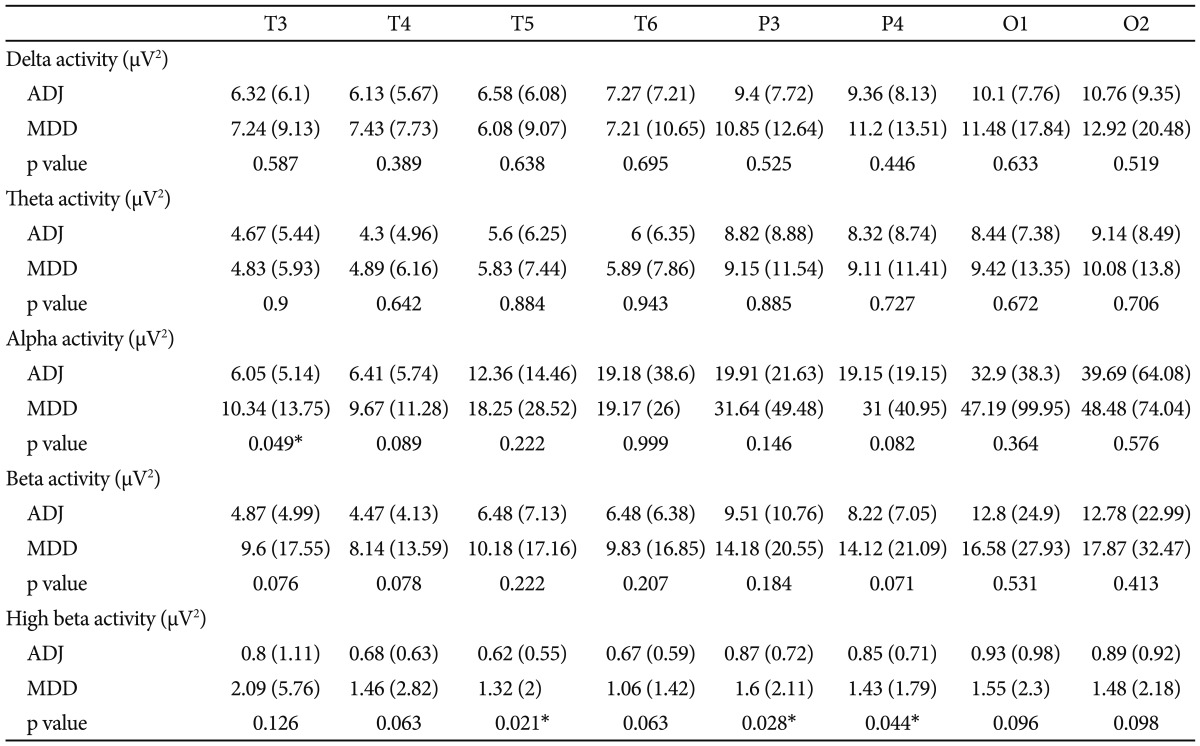
Comparing the mean absolute power value for every frequency band, there were significant differences in the alpha and high-beta bands between the ADJ and MDD groups, respectively, particularly in the right and left frontocentral areas (Table 2 and 3, Figure 1). The absolute alpha power was found to be lower in the ADJ group than in the MDD group at Fp1 (p=0.036), Fp2 (p=0.031), F3 (p=0.025), F4 (p=0.022), F7 (p=0.042), F8 (p=0.023), C3 (p=0.039) and C4 (p=0.034). The absolute high-beta power was also found to be lower in the ADJ group than in the MDD group, particularly at both the right and left frontocentral areas: at Fp1 (p=0.035), Fp2 (p=0.022), F3 (p=0.029), F4 (p=0.016), F7 (p=0.022), F8 (p=0.024), C3 (p=0.019) and C4 (p=0.028). In temporoparieatal areas, patients with ADJ showed lower alpha power at T3 (p=0.049), and lower high beta power at T5 (p=0.021), P3 (p=0.028) and P4 (p=0.044) compared to patients with MDD. There were no significant differences in the delta, theta and beta activity between the two groups, except the absolute delta power at F8 (ADJ group=5.9┬▒8.03; MDD group=19.76┬▒26.02; p=0.033) and the absolute beta power at F4 (ADJ group=7.44┬▒6.07; MDD group=13.82┬▒19.93; p=0.037). There was no significant difference in the relative power between the two groups.
Coherence
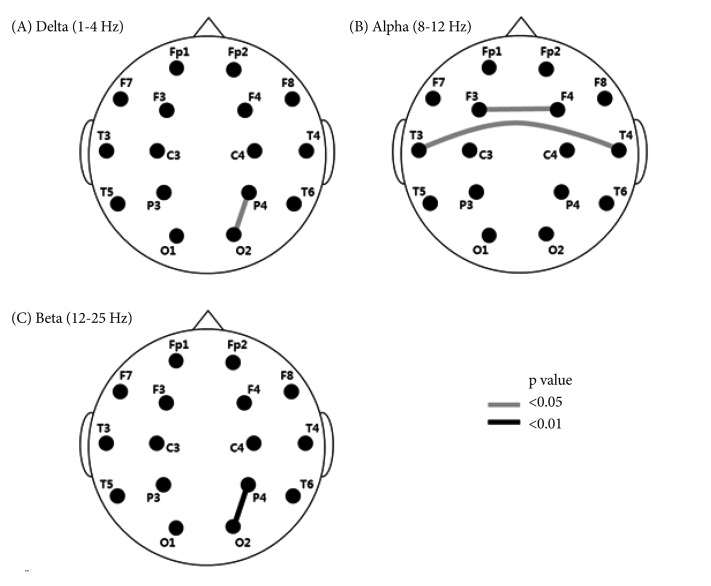
The values for intrahemispheric coherence were higher in the MDD group than in the ADJ group for the 2 frequency bands in one pair of electrodes on the right side (Figure 2A and C). The significant differences in intrahemispheric coherence value were pronounced between P4O2 for the delta band (ADJ group=60.33┬▒13.08; MDD group=66.85┬▒14.72; p=0.043) and the beta band (ADJ group=53.83┬▒14.61; MDD group=62.52┬▒12.76; p=0.009). Interhemispheric coherence values were higher in the MDD group than in the ADJ group that between F3F4 (ADJ group=76.48┬▒15.44; MDD group=83.28┬▒9.93; p=0.036) and T3T4 (ADJ group=14.98┬▒15.11; MDD group=23.64┬▒22.31; p=0.041) for the alpha band (Figure 2B).
DISCUSSION
The present study evaluated the differences in the QEEG characteristics between patients with ADJ and patients with MDD by assessing QEEG power and coherence. The major findings in this study, which distinguished ADJ with depressed mood from MDD, were as follows. First, significant differences were found in the absolute alpha and high-beta powers of QEEG parameters between the ADJ and MDD group, particularly in the frontocentral area. Second, the intrahemishperic coherence values at the right posterior area and the interhemispheric coherence values at the frontal and temporal areas were significantly lower in the ADJ group than in the MDD group.
In this study, patients with ADJ showed significantly lower absolute alpha and high-beta powers compared to those with MDD. This difference in the power spectrum may be related to the different characteristics or pathophysiology of the two disorders. The QEEG power value is usually stable because of homeostatic regulation in healthy controls,16 and it is believed to sensitively detect brain dysfunction in patients with some psychiatric disorders with excesses or deficits of any of the neurotransmitters.17,18 Abnormal QEEG findings in patients with mood disorders have been reported in many previous studies, and the changes in the power amplitude were different in different disorders. For example, alpha activity was increased in unipolar depression, but decreased in bipolar disorder.19-22
Different alpha powers between the ADJ group and the MDD group may be associated with the different severity of depressive symptoms between the two disorders. Accumulated data have shown increased alpha power in a high percentage of depressed patients.21,23 As depressive symptoms are relieved by antidepressant, the alpha activity is reduced.24, 25 It suggests that the alpha power could vary according to the severity of depressive symptoms. Depression is a common symptom in both ADJ and MDD. However, the depressive symptoms in adjustment disorder generally do not meet the threshold for criteria for major depression. ADJ is classified into subsyndromal depression together with dysthymia or minor depression. The difference in alpha power is probably due to the lesser depressive symptoms in the ADJ group than in the MDD group. However, we cannot exclude the possibility that the difference in alpha activity between the ADJ group and the MDD group is attributed to the comorbid anxiety symptom. Diminished alpha activity has been found in patients with anxiety disorder compared to healthy controls.26 Existing comorbid anxiety symptom in the patients with ADJ may contribute to their relatively lower alpha activity compared to that of depressed patients.
Another significant difference between the ADJ and MDD groups was found in the QEEG power spectrum for the high-beta band and beta band. Previously, EEG spectral analyses and brain source localization revealed excessive high-beta activity of MDD patients in the frontal region.27 The excessive high-beta activity in frontocentral area is possibly interpreted as an exaggerated or maladaptive compensatory process resulting in psychomotor agitation and rumination,28 and the high-beta activity may be correlated with the frequency of ruminative processes.29 Our results suggest that the difference in high-beta power between the ADJ and MDD groups might be attributed to the different severity and characteristics of depressive symptoms. Matousek30 reported that heightened beta activity in unmedicated, actively depressed patients was positively correlated with a recurrent course of depression. Compared with MDD, spontaneous symptomatic relief is more common in ADJ.31 The different progression of each disorder may be related to the significantly different beta power between the ADJ and MDD groups in our study. Overall, the QEEG power spectrum in our results might reflect the different characteristics of ADJ and MDD.
Our second major finding is the significant difference in coherence values between the ADJ and MDD groups. EEG coherence is one way to quantify the cortical connectivity between two spatially distributed points of the brain.32 Coherence studies can assess the loss of connections between neurons in the brain. There may be differences in either the density of the cortico-cortical connections or synaptic strengths of the connections between two brain areas or in subcortical input involving nerurotransmitters, such as serotonin, dopamine and acetylcholine.33,34 Previous studies have postulated the existence of subcortical circuits involved in mood regulation.35-37 Because these circuits are dependent upon positive and negative feedback pathways between brain structures, white matter lesions could make some patients more vulnerable to depression by damaging one or more limbs of these pathways.3 Measurement of QEEG coherence could detect the effect of lesions on the integrity of these pathways. Our results for QEEG coherence suggest pathophysiologic differences in circuitry function related to developing the affective symptoms of ADJ and MDD and may reflect different vulnerability to the mood symptoms of these two disorders.
Differences between the two groups in intrahemispheric coherence for both beta and delta bands at the parito-occiptial area were found in this study. Previous studies reported that EEG coherence for beta activity was significantly correlated with the emotional processing especially after negative emotive stimuli,38 and that EEG delta and beta coherence was related to the response to threatening stimuli.39 Therefore, the significant difference in coherence values in our results might be associated with the different responses to stressors between patients with ADJ and MDD. In addition, the differences in interhemispheric coherence in the frontotemporal areas between the two groups may result from the different susceptibility of the frontolimbic circuitry function to stress.40 These findings suggest that patients with ADJ may be more vulnerable to the negative stress in excess of what would be expected from exposure to a stressor1 although patients with MDD may show marked distress during the illness period.41-43
Our results provide an important electrophysiologic basis for the different characteristics of ADJ and MDD. However, there were some limitations in this study. One limitation of this study was that a normal control group was not incorporated. We identified differences between the two groups, but we could not identify the specific features of QEEG for ADJ and MDD. The results of this study should be interpreted with caution because the differences we identified did not indicate an abnormality of either the ADJ group or the MDD group. In spite of this limitation, this study suggests that QEEG might be useful to distinguish ADJ from MDD, supporting the validity of the diagnosis of the ADJ. Future research including a normal population is needed to uncover the temporal change in the characteristics of QEEG before and after treatment.
In conclusion, the differences in QEEG power and coherence in our investigation could provide important clues to the underlying pathophysiologic mechanisms that distinguish ADJ from MDD. These QEEG findings may be related to the vulnerability of brain circuitry functions to stressors, the severity of symptoms, and the progression of the disease. In the future QEEG can be considered a useful adjunct to clinical evaluation in the differential diagnosis of ADJ and MDD.