INTRODUCTION
"Working memory" refers to the capacity to retain information over short periods of time and to manipulate this information for future use.1,2 The frontoparietal brain network plays a critical role in working memory (e.g., Owen et al.3), and this network is therefore often called the "working memory network." Within the frontoparietal network, the dorsolateral prefrontal cortex (DLPFC) is involved in the encoding and retrieval of information, whereas memory buffering is primarily associated with the parietal lobe.3 Furthermore, verbal and object working memories are predominantly linked to activity in the left hemisphere, whereas spatial working memory is associated with the right hemisphere.4-7 These hemispheric asymmetries are not surprising when we consider, for example, that the core areas for language skills (i.e., Broca's and Wernicke's areas) are located in the left hemisphere.8 Successful performance on working memory tasks (spatial, object, and visually presented verbal tasks) relies on the appropriate processing of inputs from both the dorsal ("where" information) and ventral ("what" information) visual streams during the perceptual phase. Therefore, it is also not surprising that strong connections between the frontoparietal network and the visual system are observed during visual tasks.9,10
What remains unclear, however, is the way in which areas within the frontoparietal network are functionally integrated during various working memory tasks. A better understanding of this process should help to clarify the aspects of neural processing that are specific to various task demands or modalities. Before describing our paradigm and hypotheses, we briefly review the previous findings that motivated our study.
A recent functional magnetic resonance imaging (fMRI) study by Tomasi et al.10 revealed that a network involving the parietal and occipital cortices, the thalamus, and the cerebellum was activated when participants performed verbal working memory and visual attention tasks. That study also reported that the blood-oxygen-level-dependent (BOLD) signal within the prefrontal regions increased as a function of the working memory load. These findings suggested load-dependent activation and raised the question of whether the task difficulty modulates functional integration patterns across the working memory network.
Evidence suggests that the working memory network not only exhibits increased activation in response to increasing task loads but also shows changes in the patterns of its activity. For example, a functional shift in causation from the right to the left hemisphere has been observed during a face-matching task with a heavy memory load.11,12 These studies used positron emission tomography (PET) to investigate participants while they performed a face-matching working memory task under three different delay conditions (short, intermediate, and long) and concluded that the participants used iconic representation in the right hemisphere for the short-delay condition and elaborate rehearsal in the left hemisphere for the long-delay condition. Such previous findings could be confirmed through fMRI because fMRI allows the analysis of the correlation connectivity between brain areas.13
The results of a recent fMRI study suggested that the shift in connectivity from the right to the left hemisphere during a facial recognition working memory task depends on the extent to which the left side of the network is involved in the processing activity.14 The right frontal cortex and the right fusiform face gyrus subserve facial recognition using spatial information (e.g., the distance between the eyes and mouth), whereas facial recognition by the left prefrontal cortex is thought to depend on feature information (i.e., specific face elements). Therefore, it is possible that the brain relies on feature information more than spatial information for facial recognition as the difficulty of the task increases.
Together, these previous studies have shown that 1) the frontoparietal networks function as a working memory network; 2) each hemisphere of the network processes a different aspect of visual information; and 3) each part of the network contributes to the successful performance of the working memory task using different and complementary types of information, resulting in functional shifts in the working memory networks according to the increasing or decreasing task load. However, it remains unclear exactly how the network is functionally integrated to produce such effective shifts. Structural equation modeling (SEM) is an appropriate method of studying effective connectivity. Honey et al.4 have reported a change in functional integration that occurs during a verbal n-back task, but their result was valid only for a 2-back task, and no location-matching task was performed. Although "what" and "where" tasks have been studied in an event-related fMRI experiment,15 an effective connectivity study of face and location matching with a block task paradigm is lacking.
In the present study, we examined the functional changes that occurred across the working memory network as participants performed two visuospatial n-back tasks (a face-matching task and a location-matching task) at four different load levels (0-, 1-, 2-, and 3-back). Methodologically, we used SEM to investigate the changes in integration across the frontoparietal network. SEM is a method that dovetails with our purpose in that it allowed us to generate a causality diagram of the network connections in which facilitated and attenuated/inhibitory connections were represented for each task load. For this reason, previous studies using PET have already employed SEM to identify clear connections within the ventral visual pathways related to object perception and within the dorsal pathways for spatial perception.9 We have adapted the SEM method for fMRI n-back tasks investigated with a block design.4,8
The regions of interest (ROIs) included the right and left middle frontal gyri [MFG, Brodmann's area (BA) 46], a core area for working memory; the right and left inferior frontal gyri (IFG, BA 47); the right inferior parietal lobule (IPL, BA 40); the left superior parietal lobule (SPL, BA 7); and the medial frontal gyrus (MedFG, BA 8). Each ROI is a component of the working memory network3 and was selected based on the study of Honey et al.4 The coordinates of each region were obtained with our data, and we note that the projection from the left IFG to the left SPL comprises the phonological loop.4 We hypothesized that i) the right hemispheric network is primarily involved in face-matching and location-matching task performance under low-load condition (i.e., the 1-back task); ii) the working memory circuit shows a shift in functional causation from the right to the left hemisphere during the face-matching task with a heavy load (i.e., 2- and 3-back tasks); and iii) the circuit involved in location processing is located in the right hemisphere, even under a heavy load, in the 2- and 3-back tasks.
METHODS
Detail description of the methods is in appendix I of the supplementary material.
Participants
Sixteen healthy right-handed participants (10 males, six females) were involved in the study and had no history of psychiatric or neurological disease. The mean (SD) age was 16.9 (1.2) years (range, 15-18 years). All participants gave their written informed consent. This study was approved by the institutional review board of the Seoul National University Hospital.
Data acquisition and analysis
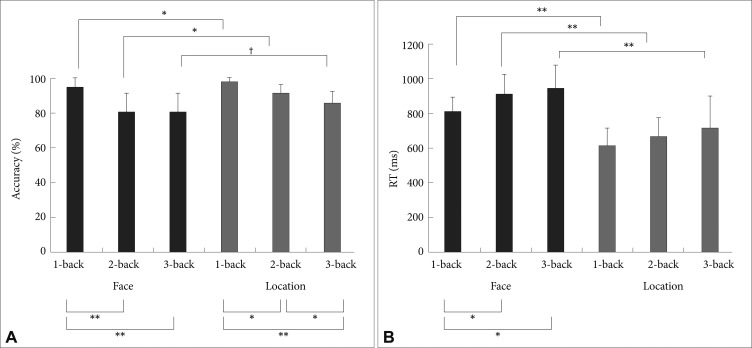
All participants performed a block-designed task in which the face stimuli were used for both the face-matching and location-matching tasks (see Supplementary Figure 1 and refer to the supplementary material). Behavioral performance during scanning was monitored in terms of reaction time and accuracy (Figure 1). Each task had four experimental conditions: 0-, 1-, 2-, and 3-back. While performing the task, data were acquired on a 1.5-T Siemens AVANTO (echo time 52 ms; repetition time 2.34s; 64×64 matrix size; field of view 210 mm). Functional images were performed in 4 runs. Images were preprocessed in SPM2 (www.fil.ion.ucl.ac.uk/spm/) using standard preprocessing steps including realignment, normalization, and smoothing with an 8 mm Gaussian kernel. A high-pass filter (cutoff 430s) and correction for autocorrelation between scans (AR1) were applied to the time series. Activation maps were generated for all levels of difficulty and contrasted with the control tasks using a general linear model. Thus, the activated regions presented high BOLD signals in the three difficulty levels relative to that of the control condition (Figures 2 and 3). Significance was set at p<0.0001 in SPM2, as in the study of Honey et al.4 We also performed one-way analysis of variance (ANOVA) of sixteen subjects with six conditions. We used a threshold of p<0.05 family wise error (FWE) correction with a minimum cluster extent of 10 voxels (Figure 4).
Based on our activation maps and previous reports, we identified frontoparietal ROIs, including the right and left MFG, the right and left IFG, the medial frontal gyrus, the left SPL, and the right IPL. In the location-matching task, the right insula was selected instead of the right IFG. MarsBar (http://marsbar.sourceforge.net) was used to extract the time series of the mean values for each ROI. Each ROI was defined using a sphere with a radius of 4 mm.
SEM
Session specific linear detrending was performed first to correct for scanner drift. Then blocks of the same type of task were extracted with a one-scan delay to correct for hemodynamic delay.4 Extracted blocks of the same type of task were concatenated. After the concatenation, the time series of each subject were normalized with their mean and SD values. During these procedures, the task-"unrelated" signal changes were discarded while keeping all task-related data. Task-related temporal activation was extracted for each region using principal component analysis (PCA). PCA calculates the eigenvalues and eigenvectors for each task, and the resulting eigenseries (i.e., the specific time series) corresponding to the largest eigenvalue is the task-related time series for each region.
We used AMOS 7.0 (SPSS Inc., Chicago, IL, USA; http://www.spss.com/Amos/) to construct an effective connectivity diagram based on a maximum-likelihood (ML) algorithm, which identifies the model covariance that minimizes the discrepancy function. Model covariance was obtained with the Gaussian noise and a path model matrix. The path model matrix describes the causal relations between source and target regions in the model.
Goodness-of-fit index (GFI) correlates with a reduction in the value of the discrepancy function of a model relative to the value of the discrepancy function with no connection. A high GFI indicates a large reduction in the discrepancy function during optimization. Root mean square error of approximation (RMSEA) is the root mean square of the minimized value of the discrepancy function of the population, divided by degree of freedom (DF), and reflects the compensation for the effect of model complexity. DF increases as the model becomes simpler, and RMSEA thus decreases under this condition. Time series data are not independent and the goodness of fit estimates may be biased. Therefore, goodness-of-fit measures and p-value in model fitting just show how well does the model fit.
Models of the face- and location-matching tasks
Figure 5 presents the model of each task, generated using the data-driven algorithm known as the "automated search method".4,8 These models were obtained with the procedure described in the supplementary material.
RESULTS
Behavioral data
Figure 1A shows the accuracy data. Average face-matching tasks score was significantly lower than the location-matching tasks score [F (1, 15)=18.81, p=0.001], indicating that the face-matching tasks were more difficult. It is also clear that the accuracy decreased as the level of difficulty increased in both tasks [F (2, 30)=68.26, p<0.001]. The interaction effect between the type of task and difficulty level was also significant [F (2, 30)=4.57, p=0.02], that is, the face-matching 2- and 3-back tasks showed similar accuracy each other but lower compared to the 1-back condition, whereas the location-matching task exhibited approximately linear decrease in accuracy with increasing difficulty (Figure 1A). Figure 1B represents mean reaction time (RT) data. Mean RT increased as the level of difficulty increases in both the face- and location-matching tasks. Main effect of difficulty level was significant [F (2, 30)=13.39, p<0.001]. Main effect of the tasks was also significant [F (1, 15)=196.53, p<0.001], indicating that the face-matching task required significantly longer RT. The interaction effect between the task and difficulty was not significant [F (2, 30)=0.76, p=0.48].
Activation map
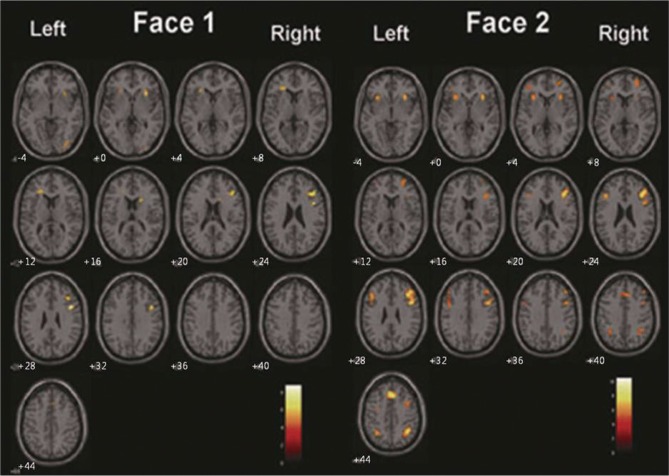
Figure 2 shows the activation maps for the face-matching working memory task averaged over all difficulty levels. In the face-matching tasks, the IFG, MFG, MedFG, and IPL were activated bilaterally (Figure 2, left). In contrast, the left MFG and IPL were not shown in the activation maps from the location-matching task (Figure 2, right). Therefore, the major difference in activation patterns between the face- and location-matching tasks is bilateral activation of frontoparietal network (face-matching task) versus right-hemisphere activation (location-matching task). Figure 3 presents activation maps for each face-matching 1- and 2-back task.
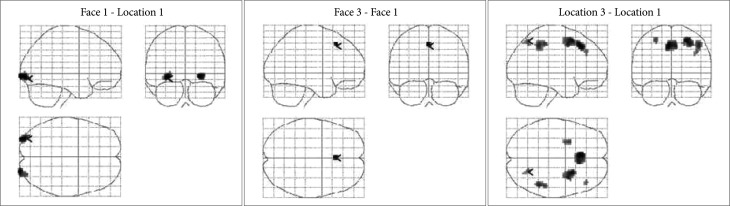
One-way ANOVA results
We conducted one-way ANOVA to elucidate the regions whose activation level significantly depend on the cognitive load, and then to compare activation within those regions across different loads. Figure 4 shows T-contrast maps of one-way ANOVA. Relative to the 1-back location-matching task, the 1-back face-matching task required significantly greater activation in bilateral occipital area. Increased bilateral occipital activity was observed in face-matching task, compared with location-matching task, across load levels. The 3-back face-matching task activated the BA 8 region including the supplementary motor area, compared with the 1-back condition. In location-matching task, the high-load condition recruited more the right parietal activation than the low-load condition. These results provide more complete picture of how activation changes between conditions as well as between tasks. The results of the one-way ANOVA are presented in the Supplementary Table 1 of the supplementary material.
Effective connectivity diagrams determined with SEM
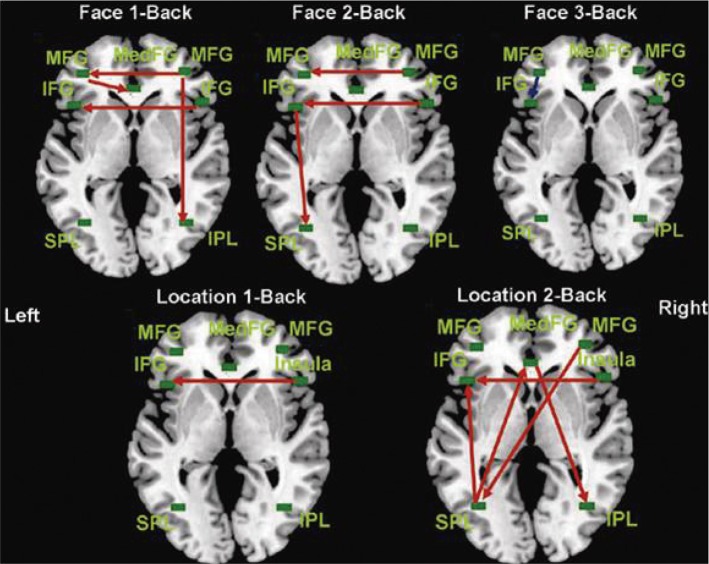
Figure 6 shows the effective connectivity diagrams for the face-matching task (top) and the location-matching task (bottom), determined by the SEM analysis. Red arrows represent positive path coefficients, which signify increase of BOLD signal in the target regions as BOLD response in the source regions increased. The blue arrow indicates a negative path coefficient: the target BOLD response decreased as the source BOLD increased. We used GFI and RMSEA as well as p-values to evaluate our models. The GFI and RMSEA are widely used as the statistical criteria for model acceptance,16 with assumption that data observations are independent. However, our fMRI time series data are not independent each other, thus, some bias may exist. Therefore, we do not intend to use these measures for accepting or rejecting our models, but it is still true that these GFI, RMSEA, and p-values reflect how well our models fit with the data. The fit indices from the location 3-back task did not meet the general acceptance criteria (GFI=0.869; RMSEA=0.169; χ2=32.103; DF=12; and p=0.001).
In the face-matching 1-back connectivity diagram in Figure 6 (top left), which satisfied the acceptance criteria (GFI=0.982; RMSEA <0.001; χ2=3.766; DF=11; and p=0.976), the right MFG was an important region in working memory considering its direct/indirect connections with the left MFG, MedFG, and IPL, showing dominance of the right hemisphere in the face-matching 1-back task. DF was calculated subtracting the sum of the number of causal relationships (=10) in the model from the number of all possible causal relationships (=21). Thus DF was 11.
Next, the face-matching 2-back data (Figure 6, top middle) also showed good model fitness by satisfying the criteria for the model (GFI=0.949; RMSEA=0.026; χ2=11.434; p=0.408). In this condition, connection from the left IFG to the left SPL was observed, which may mediate the articulatory rehearsal.4,17 Therefore, unlike in the face-matching 1-back condition, the left hemisphere was more active in the 2-back task; however, the interhemispheric connectivity from the right hemisphere was still observed.
In the fact-matching 3-back task (Figure 6, top right) (GFI=0.929; RMSEA=0.097; χ2=17.047; DF=11; and p=0.107), the left MFG → left IFG was the only significant connection, which suggests that these two regions compete each other during the working memory task with heavy load (see Kim et al.18). Anatomically, the MFG is part of the DLPFC and the ventrolateral prefrontal cortex (VLPFC) includes the IFG, respectively. The DLPFC plays a role in active manipulation and monitoring information while the VLPFC is involved in comparing information.18 Thus, the result from the face-matching 3-back task suggests that manipulation of information has priority for efficient processing under heavy task load.
The location-matching 1-back task (bottom left in Figure 6, GFI=0.930; RMSEA=0.076; χ2=16.138; DF=12; and p=0.185) showed a significant connection from the right insula to the left IFG. The location-matching 2-back connectivity data (Figure 6, bottom middle, GFI=0.957; RMSEA<0.001; χ2=9.999; DF=12; and p=0.616) had also the connection from the right insula to the left IFG, and additionally had significant connections of the right MFG → left SPL, left SPL → left IFG, left SPL → MedFG, and MedFG → right IPL. The location 3-back task (GFI=0.869; RMSEA=0.169; χ2=32.103; DF=12; and p=0.001) had significant connections of The right insula → left IFG, left SPL → MedFG, and MedFG → right IPL, and right MFG → right insula. Because the fitness measures do not satisfy the criteria, we do not present the connectivity pattern of location 3-back task in Figure 6. Path coefficients and p values are presented in Supplementary Table 2 of the supplementary material.
DISCUSSION
Hypotheses and findings
In the present study, we investigated changes in the functional integration of the working memory network during the performance of two visuospatial n-back tasks (a face-matching task and a location-matching task) with three load levels (1-, 2-, and 3-back) and a control condition (0-back) using a sophisticated SEM method. Our hypotheses and findings are as follows. 1) Face-matching and location-matching tasks are associated with functional activities in the right hemisphere under the 1-back condition. This prediction was confirmed, as shown in the face-matching 1-back effective connectivity diagrams. The right MFG → right IPL connection suggests top-down imagery rehearsal.11,12,17 The location-matching 1-back results also reveal the influence of the right insula on the left IFG. 2) During the face-matching task under a heavy load (i.e., 2- and 3-back tasks), the circuit activity was assumed to shift functionally from the right to the left hemisphere. Our data did confirm this functional shift, as demonstrated by the face-matching 2-back connectivity diagram. In addition, the left IFG → left SPL connection observed in the face-matching 2-back result suggests the role of the articulatory rehearsal (or the phonological loop) during working memory processing. As described in previous studies,12,19 working memory with longer delays may require more elaborative rehearsal and encoding strategy for processing the distinctive local or global features of the stimuli. The elaborate encoding in our face-matching n-back task includes making judgments about similarities of facial expression between faces. 3) We expected that the location-processing circuit would be observed in the right hemisphere during the 2-back task; however, the results show that the effective connectivity was bilateral (Figure 6). This result suggests that location processing requires additional recruitment of the object working memory circuit in the left hemisphere.19,20
Differences between the models of the face- and location-matching tasks
The major difference between the two models is the connectivity between MedFG and other regions (Figure 5). In the face-matching model, the MedFG is connected with other frontal area, receiving inputs from bilateral MFG. In the location-matching model, in contrast, the MedFG has connection with bilateral parietal regions (left SPL and right IPL). Therefore, the face-matching task model emphasizes the role of frontal areas during the face-matching task in our data. Indeed, a previous study reported activation in the frontal regions including MFG, MedFG, and fusiform face area (FFA) during a face-matching task.14 Functional connections between the MedFG and parietal regions (SPL and IPL) may represent the dorsal stream of location information processing.21-23
Differences in the levels of activation in the left and right hemispheres between 1- and 2-back face-matching tasks
We hypothesized that a functional connectivity would shift in the face-matching tasks from the right hemisphere network to the left hemisphere network with increasing task loads. Our imaging data confirms the hypothesis: Figure 3 shows the activation maps in which right-hemisphere activation is dominant in the 1-back task (low load) and bilateral activation in the 2-back (higher load) task. Right hemisphere dominance in the 1-back task is as expected because the right hemisphere is mainly involved in general perceptual matching tasks, and is consistent with the effective connectivity results in Figure 6. In the face 2-back condition, bilateral activation is observed (Figure 3) and it reflects relatively greater contribution of the left hemisphere (see Figure 6, the connectivity diagram). That is, although the right hemisphere is also activated in the 2-back task, its signal intensities do not necessarily correspond to the connectivity. A recent study also reported a similar discrepancy: they reported higher effective connectivity in the right parietal area while the signal intensity in the same area did not differ between hemispheres.24 Our result therefore suggests that effective connectivity and signal intensity are closely related, but may reflect different aspects of the functions of the brain.
Changes in the connectivity pattern with increasing loads
We observed the connectivity shift from right to left hemisphere in the face-matching task, which is also true for the location-matching task. That is, as the task load increased, the causal relationships in the left hemisphere became more prominent. This is not very surprising because more active maintenance required in longer delay mainly relies on activities of the verbal circuit in the left hemisphere. For example, Glabus et al.25 reported that verbal processing yielded better performance than visuospatial processing on an n-back memory task in which the spatial position of number was asked to memorize. Our data also show that verbal working memory processing in the left hemisphere is associated with stable performance in the 2-back tasks: the effective connectivity diagram of the location 2-back task (Figure 6) exhibits the right MFG → left SPL connection that indicates encoding spatial information using a verbal buffer (e.g. Bullmore et al.8), and the left SPL → left IFG connection suggesting the retrieval of information via the phonological loop (e.g. Honey et al.4). Connections from the left SPL to the right IPL via the MedFG suggests that spatial information stored in the verbal buffer is decoded in the visuospatial buffer in the right IPL.3,21 In addition, MedFG activation is thought to reflect spatial attention3,26 and formation of an articulatroy motor trajectory.27 Taken together, these connectivity patterns suggest that the brain incorporates both distributed and parallel processing under heavy working memory load.
Turning to the face-matching task, a negative coefficient between the left MFG and the left IFG only was significant in the 3-back condition, which suggests more active functioning of the MFG and its inhibiting the IFG activation. This is interesting because no connectivity between these two regions was observed at lower difficulty conditions (i.e. 1- and 2-back conditions). These two regions may be functionally independent under low load and equally contribute to high accuracy. The MFG is thought to be involved in active manipulation and monitoring and the IFG seems to be involved in active comparison of information.18 At a high difficulty level, however, the working memory capacity may be saturated. As the available resource is not enough, it is likely that the function of manipulation and monitoring by the MFG may have priority for efficient processing while the IFG activation is inhibited.
Difference between the connectivity patterns for the face- and location-matching tasks
We observed causal connections from the MFG to IPL and from the IFG to SPL in the face-matching 1-back and 2-back diagrams (Figure 6), suggesting strong influence of top-down processing. In contrast, both top-down (right MFG → left SPL and MedFG → right IPL) and bottom-up (left SPL → left IFG and left SPL → MedFG) processes were implicated in the location-matching 2-back task.
Another difference is that, unlike the face-matching task, the location matching (2-back) task was associated with bilateral causal connections (see location 2-back and face 2-back diagrams in Figure 6) that consisted of interaction between the frontal and parietal regions. The results of bilateral connectivitiy during the location-matching task suggest that the left hemisphere network for verbal working memory is also recruited for location processing. In fact, spatial information can be coded and processed in two ways: Kosslyn et al.28,29 suggested that the "categorical" and the "coordinate" processing of spatial information are mediated by the left and right hemispheres, respectively. Categorical coding does require verbal processing, and considering this, our participants may have used a verbal strategy of categorization, such as "up," "down," "right," "left," or combinations of these (e.g. "up-right" and so on) to specify the location. Such verbal processing and spatial processing are likely to occur in parallel, that is, converting verbal information into spatial information and articulatory rehearsal would take place together.28,29 To summarize, the location information in our data may have been processed by the left SPL, but also may have been verbalized through the articulatory rehearsal, as observed in SPL → IFG causal connection, and the verbalized location information (e.g., "up-right," "down-right," or "up-left") might have been mediated by the right IPL.
Lastly, in the face-matching 1- and 2-back tasks, the right IFG → left IFG causation was apparent and the right insula → left IFG causal connection was observed in the location-matching 1- and 2-back tasks. Right insula in the location task corresponds to right IFG in the face task. This common connection from right IFG to left IFG may be due to our mixed design of the two tasks in each imaging session. Although there were task-switching signs during the scans, some participant could do erroneously face-matching in location-matching condition or vice versa in different proportion.
One-way ANOVA
In one-way ANOVA, which examined level of activation dependent on the task load and significantly different activation between the two tasks and between two specific conditions (Figure 4), the face-matching task required greater activation in the occipital area (BA 18). Considering that the fusiform face area (FFA), a specialized area for face perception, is located ventrally to BA 18, this occipital difference between the two tasks is reasonable. In the face-matching task, activation of BA8 became stronger as the task load increased, suggesting the role of attention. In the location-matching, increasing task load was associated with greater activation in the right parietal lobule as well as MGF emphasizing the visuospatial function in which the right hemisphere network is mainly involved.
Conclusion
The patterns of the effective connectivity we observed show that the brain network circuits are actively and specifically selected for efficient and optimal information processing in different working memory tasks, and under different task load. Tasks with low degrees of difficulty engaged the visual imagery circuit in the right hemisphere, whereas the task with higher load (2-back) appeared to use the phonological circuit or articulatory rehearsal in addition to the visual circuit. Note that the use of the phonological loop is a speculation based on the past studies, therefore a further study is necessary to confirm this. For example, one group could be asked to use a verbal strategy and another group could be told to use only a visual strategy for location matching.
Our results confirm and extend earlier PET-based findings. PET studies showed that a difficult face-matching can be processed in the left hemisphere network with an elaborative rehearsal and encoding strategy. We were able to observe the patterns of effective connectivity within the frontoparietal network using the fMRI technique, which provides better spatiotemporal resolution. However, this study also has some possible issues and limitation in our methodology, which was discussed as appendix II and III in the supplementary material.
To conclude, our results suggest that the articulatory rehearsal may contribute to an elaborate encoding strategy that is mediated by the left IFG, and we observed the inhibitory role of the left MFG on the left IFG in the face-matching 3-back task. This finding from 3-back condition is novel, which was not found in previous study. Lastly, the effective connectivity patterns observed in the present study account for the verbal and spatial processing, highlighting the dynamic processing of working memory.