INTRODUCTION
The Rosenberg Self-Esteem Scale (RSES) is one of the most widely used self-esteem measures in social science research.1-7 It was developed by Morris Rosenberg in 1965 and is widely used in psychology, mental health and psychiatry. The RSES is a short, easy to administer, Likert-scale type test, with ten items answered on a four point scale with responses ranging from strongly disagree (1) to strongly agree (4). In the original version half of the items are positively worded; for example, "On the whole, I am satisfied with myself", while the other half are negatively worded; for example, "At times I think I am no good at all". Total scores range from 10 to 40, with the higher the score-the higher the level of self-esteem. Versions of the scale have been tested for reliability and validity in many languages and have, on average, been found to be effective.3,4,8-10
The factor structure of the RSES has been extensively studied, the debate focusing on whether it is a uni-dimensional or a two-dimensional model.4,11-15 Recently, Marsh12 concluded that the structure of RSES is best represented as a uni-dimensional model with ephemeral method effects, where two strategy approaches are used in the method effects by introducing correlations among the positively worded items and/or among the negatively worded items,18 these being the related uniqueness (CU) strategy and the latent method factor (LMF) strategy.16,17
Among the negatively worded items that are attributed to the indeterminable factor structures, the most common item is "I wish I could have more respect for myself". Pullmann and Allik10 found that this item yields a low factor loading and communality. Beeber9 found that it shows a low item-total correlation of 0.23 and the same result was indicated by Farruggia.27 In our previous study of the Thai version of the RSES, in a sample of 664 students, we also found an unsatisfactory loading of this item, with a low item-total correlation of 0.015 found (the corrected alpha when this item was deleted was 0.89). These various results strongly indicate that this item requires re-drafting. We assume the reason why it causes a problem is that it requires the respondent's focused attention simply to understand its true meaning. Respondents who are not careful enough may mistakenly treat this item as having a positive rather than a negative meaning. To put it another way, it brings about an acquiescent response bias rather than a cultural bias, as this problem is also found in other studies mentioned previously. In order to test our assumption and improve the scale, we therefore re-worded this statement from negative to positive, to test if the problem arose from the negative wording plus how good the model fit would be after the revision.
In this investigation, we compared the model fit results obtained in previous studies with the results from this present study, using an independent sample.
METHODS
Participants
In total, 851 students attending a university in northern Thailand, with ages ranging from 18 to 34 (mean±SD, 19.51±1.7) participated in this study. There were two sub-studies carried out within this project. In the first, 1,664 participants completed the Thai version of the original RSES (five positively worded items and five negatively worded items). In this group, the mean age was 19.87 (SD 1.85) (min-max=18-34), with 57% of the group being female. In the second study, 2,187 students participated and completed the revised version of the RSES. The mean age of this group was 18.63 (SD 0.63) (min-max=18-23), with 56% of this group being female (Table 1).
Instruments
The RSES was translated into Thai-with cultural adaptations, using the following steps. First, the authors translated the original English version of the RSES into Thai, then it was back-translated by a bilingual person (an English-Thai school teacher), who had not seen to the original RSES before. Cultural adaptations and comparisons of reading difficulty were checked. Third, both versions were compared and reviewed by consensus (comprising a bilingual psychologist and the authors), with a small number of disagreements found and corrected in this way. Finally, grammatical and printing errors were corrected before experimenting with the final version in a field trial. The Thai-RSES was tested for psychometric properties and found to demonstrate good reliability, and showed concurrent validity with attachment anxiety22 and the Thai depression inventory (TDI), plus exhibited construct validity.9 For the revised version, the authors re-worded one designated item (no. 5, Table 2) by changing "I wish I could have more respect for myself" into "I think I am able to give myself more respect". We used the same translation process as we had done in the original until satisfaction was achieved, and before administering it with the sample.
Procedure
The students were informed about the study after a class taken by a research assistant who was not otherwise associated with the class. Interested students were provided with a take-home pack containing an information sheet, questionnaires and an informed consent form. Each student later returned the completed questionnaires and the completed informed consent forms to the research assistant, who then separated the informed consent form from the anonymous data.
Data analysis
Two samples were independently analyzed. Data screening for factor analysis was conducted and found to be acceptable in both samples (i.e., an acceptable reliability; Cronbach's α>0.6), and all items showed skewness and kurtosis of <±2)(2). Missing values were managed by replacing them with the series mean. The sampling adequacy was good, with Kaiser-Meyer-Olkin (KMO) values of 0.91 for Group 1 and of 0.83 for Group 2. Bartlett's test of sphericity was significant in both samples (p<0.001)(3), and the maximum likelihood method, with an oblique rotation, was performed on the items.
Confirmatory Factor Analysis (CFA) was used to determine the fit and the number of factors to retain from the previously identified two-factor model. We chose to analyze and compare the results of both studies in terms of a uni-dimensional model with method effect, using the correlated uniqueness (CU) approach.12 Amos 1823 was used to compare the observed structure with the structure proposed in the theoretical model. The ML estimation method was used to test the covariance matrix and determine how well the model fitted the sample data. In investigating the fit indices associated with the ML estimation, a two-factor solution was shown to be adequate. For the model fit indices, the following criteria were used: a Comparative Fit Index (CFI) of ≥0.95, a Non-Normed Fit Index (NFI) or Tucker-Lewis Index (TLI) of ≥0.9, a root-mean-square error of approximation (RMSEA) of ≤0.6 - with values as high as 0.08 indicating a reasonable fit, a standardized root-mean-square residual (SRMR) of ≤0.08 (4-6), and the results of χ2/df being <3 (2). Modifications were made to the model after the initial analysis using modification indices, and internal consistency/reliability was determined by calculating Cronbach α coefficient.
RESULTS
There was no difference between the two groups in terms of age and gender distribution, and both groups scored higher in attachment anxiety scores than in attachment avoidance. There was no difference in both scales, including the depression scale scores, between the two groups.
Internal consistency was good, with a Cronbach's alpha of 0.86 in the first sample and 0.84 in the second sample. The mean rating of the items ranged from 2.23 to 3.31 in the original version, and from 2.95 to 3.36 in the revised version. The original version yielded factor loadings ranging from 0.277 to 0.808 - with communalities of 0.077 to 0.661; whereas, the revised version yielded factor loadings ranging from 0.361 to 0.814 - with communalities of 0.149 to 0.672 (Table 2).
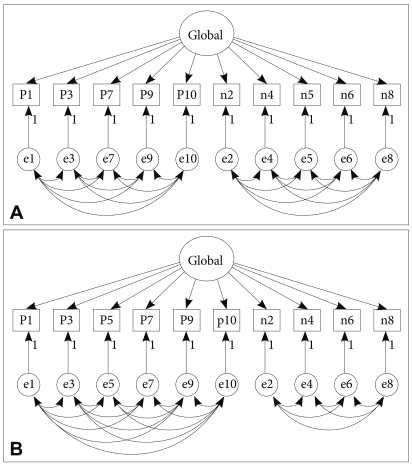
When calculating the CFA, a uni-dimensional construct with method effect testing and using a correlated uniqueness was adopted (as shown in Figure 1). The original version consisted of five positively worded items (Items 1, 3, 7, 9 and 10) and five negatively worded items (Items 2, 4, 5, 6 and 8) (Figure 1A). In the revised version, item 5 was changed in a positive direction (see Table 2) to leave six positively worded and four negatively worded items (Figure 1B). A comparison of the two models (Table 3) showed that the revised version yielded an excellent model fit (χ2=29.19, df=19, n=187, p=0.063, GFI=0.970, Non-Normed Fit Index (NNFI) or TFI=0.969, NFI=0.964, CFI=0.987, SRMR=0.040 and RMSEA=0.054).
Concurrent validity
After investigating the correlation between the revised version and external measurements, the results were as expected. The attachment anxiety sub-scale and avoidance sub-scale correlated negatively with the revised RSES, as they did with the original version (r=-0.23, p<0.01; and r=-0.17, p<0.01, respectively). The same results occurred with the depression scale, TDI (r=-0.30, p<0.01).
DISCUSSION
It is clearly shown from the results that the mean score for item 5 increased from 2.23±0.82 to 3.18±0.66, meaning the total score for this scale increased significantly (t=4.0, p<0.01). More importantly, it improved on the factor loading and communality of the item, confirming that the assumption of response bias had been corrected. This is supported by a previous study by Marsh,11 who concluded that negatively worded items create more difficulties than positively worded items, and when some negative item(s) are manipulated, a better overall goodness-of-fit outcome results. However, the manner in which this negative item (item 5) has been changed into a positive one has differed from one investigator to another. For example, Greenberger28 re-worded this item to: "I think I have enough respect for myself". Our position is that while Greenberger emphasized "quantity" - enough or not enough - the original sentence is concerned with "wishing", so we therefore re-worded the item to: "I think I am able to give myself more respect" - thus implying the response "I have enough self-esteem, but I can gain more if I wish to."
When compared to the original version the revised version demonstrated a comparable internal consistency, though it may be expected to produce a higher level of reliability than the original version if used with a sample size of similar magnitude to the original. In addition, the revised version produced an excellent model fit, with all the required criteria being met (goodness of fit>0.95, SRMR<0.08 and RMSEA<0.06, χ2=29.19, df=19; with a p-value >0.05 indicative of a rejected H) - confirming the validity of the factor structure.
Besides item '5', item '7' appeared to be low in terms of communality both in the original and the revised version (h2=0.194 and 0.149 respectively). In fact, both models yielded low values for communality - item 5 being the lowest and item 7 the second lowest, indicating that it is a poor indicator of this factor. Exploratory factor analysis showed that item 7 had a low factor loading (0.36) and a cross-loading on the other factor which led to relatively low communality on the designated factor (<0.2). Taking the content of item 7 into account, even though its meaning seems to be positive, that may not be the case; it could be regarded as 'neutral'. This unclear message may lead to it being a grey zone - with poor item-total correlation and ultimately producing unsatisfactory factor loading. All in all, item 7 should be further investigated and revised along the same lines we did with item 5. In addition, low factor loading and communality can also be attributed to sample size if the communality is not strong enough (less than 0.4), and if the size of the sample has a greater impact upon factor analysis outcomes.29
Limitations
Further studies of the revised model should be conducted employing a larger sample size, plus an invariance test of any gender differences should be addressed. Finally, a test-retest study should be conducted, since the present cross-sectional study limited our ability to draw conclusions regarding the stability of the construct.12