INTRODUCTION
The capacity for memory in the elderly is a sensitive indicator of aging and senile diseases related to cognitive impairment. Further, amnesia tends to worsen with age, and an early symptom and hallmark of Alzheimer’s disease (AD) is memory impairment [1]. Memory functions are usually measured by neuropsychological tests. To this end, a number of reliable neuropsychological tests that can measure memory function have been introduced and used in the clinical setting [2,3]. However, the psychological tests are conducted over a fairly long period of time; thus, to obtain accurate results, the subject must remain focused and motivated. Furthermore, the hearing and vision loss that is characteristic of the elderly can lead to inaccurate results. Thus, there is a need for new tools that can measure memory both easily and more objectively.
In recent decades, numerous studies have been published on correlation between brain imaging techniques and cognitive impairment of individual. Brain Magnetic Resonance Imaging (MRI) reveals pathologic changes at a structural level, which usually occurs in neurodegenerative disorders, for example, the decrease in the size of the hippocampus and the loss of the volume of gray matter in the medial temporal lobe, are structural changes present in neurodegenerative disorders [4]. Functional MRI (fMRI) technique also shows functionally altered cognitive processes based on mechanism of increase or decrease of blood flow reflects a neuronal activity of brain [5], and various statistical techniques have been developed to estimate the degree of cognitive impairment using an fMRI. For example, functional connectivity network model has been suggested as an effective marker for the detection of changes in brain function in MCI subjects [6,7], and an altered resting state activity of fMRI act as an early marker for mild cognitive impairment and mild AD [8]. However, in a clinical perspective, the brain MRI is still an expensive technique for a screening method as an early detection of cognitive impairment. Therefore, in this study, we developed an EEG technique with a machine learning features for assessing the working memory function in elderly individuals as a cost-effective way and the proposed algorithm was directly evaluated with memory task function of elderly subjects.
A resting quantitative EEG (qEEG) can be easily measured in a few minutes, so it is relatively simple to obtain data from individuals with testing limitations, such as elderly, pediatric, or neuropsychiatric patients. Several qEEG markers related to cognitive function have been reported in elderly subjects, including increased absolute and relative power in the theta band, which reflects cognitive impairment in the elderly, and increased delta power in the later stages of deterioration [4]. The theta power is correlated with cognitive decline in elderly patients within 7 years [8], whereas the spontaneous alpha peak frequency slowed with age and was correlated with working memory [5]. Temporoparietal coherence was decreased in individuals with Alzheimer’s-related dementia, compared to those who were aging normally [6]. Further, the synchronization of the alpha, beta, and gamma EEG bands is decreased in patients with cognitive impairment [7]. The clustering coefficient of the lower alpha and beta bands was likewise diminished, and the characteristic path length of the lower alpha and gamma bands was short in individuals with Alzheimer’s-related dementia compared to controls [9]. Better combinations of the qEEG parameters are expected to improve the measurement of memory function in the elderly. However, additional evidence must be accumulated prior to clinical application.
We aimed to develop qEEG markers for assessing the working memory function in elderly individuals. In the first stage, we applied the feature extraction technique and statistical analyses to assess the feasibility of qEEG parameters as input data for a machine learning algorithm. In the second stage, we applied a Support Vector Machine (SVM) to identify and classify the severity of cognitive decline in the subjects.
METHODS
Subjects and experimental design
The study included 164 older subjects [66 males and 98 females ranging in age from 58 to 79 years with a mean age of 67.96±4.74 (mean±SD) and 8.91±4.48 (mean±SD) years of education] who lived in Gong-ju, South Korea and were enrolled in a program for the early detection and management of dementia at Gong-ju National Hospital.
Demographic characteristics and medications of all subjects are summarized in Table 1. In this study, we excluded elderly people who were clinically diagnosed with cognitive impairment diseases or neurodegenerative diseases such as AD, Parkinson’s diseases (PD), PD-related disorders, and Huntington’s disease. We also excluded people who had brain injury history from head trauma, hemorrhagic or ischemic stroke, and other causes. A total of 78 elderly subjects were on antihypertensive drugs while 30 were on diabetic medications. Eight subjects were on non-benzodiazepine sedative drugs such as zolpidem and trazodone. Two subjects were on low-dose short-acting benzodiazepine drugs at night. No one was prescribed cognitive impairment medications or other drugs that might affect the central nervous system or has a potential to alter EEG activities.
This study was conducted in compliance with the ethical guidelines of the Gong-ju National Hospital Institutional Review Board (IRB No. 2009-5) and the Declaration of Helsinki [10].
Memory tasks and subject grouping
Memory and cognitive decline is closely related with aging, and early stage of cognitive impairment, even in the absence of diagnosed neurodegenerative diseases. In this study, the two clinical memory tasks used to assess the memory impairment of each subject were a letter numbering task and a spatial span task. In the letter numbering task, the subject was required to listen and memorize a different combination of numbers and letters during each trial. The letters consisted of seven syllables representing the days of the week (Monday to Sunday) in Korean, such as ‘Wall,’ ‘Hwa,’ ‘Soo,’ ‘Mok,’ ‘Guem,’ ‘Toh,’ and ‘ill.’ The subjects were first asked to repeat the seven syllables, and were then asked to recite the first number in ascending order and the letters in the order of Monday to Sunday [11,12].
The spatial span task included a board featuring 10 cubes with numbers printed on the sides facing towards the examiner but nothing on the sides facing the subjects. The examiner tapped five different cubes in a specific sequence and then asked the participant to tap the cubes in the same sequence (spatial span forward) or in the reversed sequence (spatial span backward). A total score was calculated by summing the forward and backward scores [12,13].
The subjects were grouped into low-, moderate-, and high-performance groups based on the results of each task. The subjects with task scores in the lowest 30 percentile were assigned to the low-performance group, subjects with scores in the highest than 30 percentile were assigned to the high-performance group, and the rest of the subjects were assigned to the moderate-performance group.
EEG measurement and data preprocessing
A set of 64 Ag-AgCl electrodes (FP1, FPZ, FP2, AF3, AF4, F7, F5, F3, F1, FZ, F2, F4, F6, F8, FT7, FC5, FC3, FC, FCZ, FC2, FC4, FC6, FT8, T7, C5, C3, C1, CZ, C2, C4, C6, T8, M1, TP7, CP5, CP3, CP1, CPZ, CP2, CP4, CP6, TP8, M2, P7, P5, P3, P1, PZ, P2, P4, P6, P8, PO7, PO5, POZ, PO4, PO6, PO8, OB1, O1, OZ, O2, and OB2) mounted in a Quik-Cap were placed on each subject’s scalp to record the EEG signals. The electrodes were placed according to the modified 10-20 placement scheme (Compumedics USA, El Paso, TX, USA). An electrooculogram (EOG) was measured through two additional electrodes that were placed on the lower and lateral sides of each subject’s right eye. The EEG and EOG signals were amplified using the NeuroScan SynAmps2 amplifier system (Neuroscan, Charlotte, NC, USA). Before acquiring the measurement, the impedance of all electrodes was adjusted to under 5-10 kΩ [8]. The ground electrode was placed on the forehead and used as a reference.
To record resting state EEG, all subjects were required to sit quietly with their eyes closed during the recordings. The EEG signals were preprocessed with a 0.15-200 Hz band-pass filter and digitized using a sampling rate of 1000 Hz. We used Matlab ver. 7.14.0 (MathWorks, Natick, MA, USA) with the EEGLAB toolbox [14] to preprocess and analyze the EEG data. The data were detrended to remove the direct current (DC) component and segmented into 10,000- ms intervals as a unit of epoch.
The NeuroGuide software (Applied Neuroscience, Tempa, FL, USA) was used for artifact rejection and to calculate the EEG parameters. Using visual inspection, we chose tens of seconds of artifact-free area and some artifact area (e.g. eye movement and muscle movement) on the EEG, because the software automatically selects the artifact area from the complete EEG data. Afterward, we calculated the absolute frequency power of the EEG data at each channel and the theta (1-4 Hz), delta (4-8 Hz), alpha (8-12 Hz), beta (12-25 Hz), and gamma (30-40 Hz) frequency bands. A total of 300 spectral powers consisting of 60 different EEG channels and five different frequency bands were calculated. The relative frequency power was also calculated in the same manner as the absolute power and the amplitude asymmetries were likewise calculated in the same manner at each of the frequency bands. However, there were 1,770 asymmetries for each of the bands and a total of 8,850 asymmetries for each subject because the data was calculated between two different channels. Finally, the coherences and phase delays were calculated in the same manner as the asymmetry data.
The EEGLAB toolbox [14,15] and the brain connectivity toolbox [16] were used to calculate the characteristic path length, the clustering coefficient, the local and global efficiency, the betweenness centrality, and the transitivity and community to assess the functional brain connectivity properties of each subject. The total number of EEG parameters was 28,365.
Feature selection with statistical analysis
To be a well-trained machine learning system, the extraction of feasible features among the various parameters is important. The 28,365 EEG parameters and feasible features were analyzed using Student t-tests to identify the parameters and features that were statistically significant at p<0.05. The statistically significant EEG features (p<0.05) were then used as a training and a test set for the SVM algorithm. A false discovery rate (FDR) was used to minimize potential errors resulting from multiple comparisons. The FDR is a less stringent method for controlling type I errors in null hypothesis testing when conducting multiple comparisons compared to procedures for controlling the familywise error rate (FWER), such as the Bonferroni correction [17,18]. The final results could potentially be influenced by the feature selection strategy regardless of whether they were based on the original p-values or the FDR corrected p-values; therefore, the final results from both methods were compared in regards to the performance of the proposed system.
Machine learning algorithms
In this study, an SVM algorithm with a Radial-Basis-Function Kernel was used to classify whether the subject belonged to the low- or high-performance group based on the calculated EEG parameters. SVM is a supervised learning model that constructs hyper-planes that optimally separate the data into two classes in a higher-dimensional space [19,20]. A training and a test set permutation and a 5-fold cross validation were conducted to verify the accuracy of the trained SVM. The EEG parameters were normalized using the z-score function at each domain.
RESULTS
Feature extraction
To determine the statistical significances of the EEG parameters, multiple Student’s t-tests were applied to the low- and high-performance group EEG parameters. An FDR was used to control for false positives among the significant results caused by large-scale multiple testing. We included various aspects of the EEG parameters to accurately reflect the diversity of brain activities. The spectral, non-linear analysis parameters were included as well as the brain connectivity parameters. As a result, 5,333 parameters were selected for the letter numbering task, and 763 parameters were selected for the spatial span task (Table 2).
Receiver operating characteristic (ROC) curves
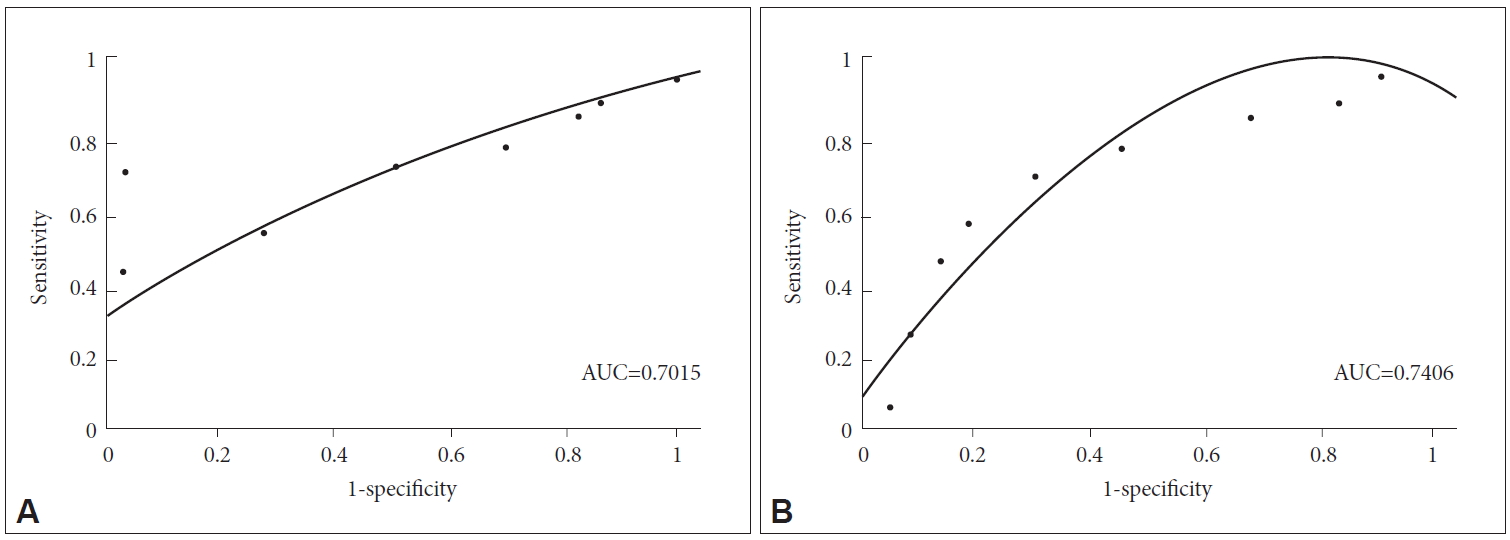
Using the original p-values in the feature selection step, the sensitivity and specificity of the classification algorithm were 0.71 and 0.94, respectively, for the letter numbering task when the threshold score value was 3. The corresponding accuracy and positive predictive value (PPV) were 0.89 and 0.79, respectively. The ROC curve for the letter numbering task classification result was plotted (a) using different threshold values (2 to10) and the AUC was 0.70. For the spatial span task classification algorithm, the sensitivity and specificity were 0.70 and 0.72, respectively, when the threshold value was 13, and the accuracy and PPV were 0.7 and 0.69, respectively. The ROC curve for the spatial span task classification algorithm was plotted (b) using different threshold values (9 to 18) and the AUC was 0.74 (Figure 1). Using the FDR corrected p-values, the AUC of the ROC curve was 0.65 for the letter numbering task and 0.60 for the spatial span task.
DISCUSSION
In the work described herein, we achieved the classification of subjects according to their cognitive task results and were able to differentiate among different performance groups. We analyzed EEG data obtained using a program for the early detection and management of dementia. The SVM algorithm was applied to different EEG parameter analysis methods including frequency-domain features, non-linear method features, and connectivity features. To evaluate the performance of the implemented system, the subjects were separated into low-, moderate-, and high-performance groups based on the cognitive task results, and the performance of the SVM was evaluated using a 5-fold cross validation. Reliable performance levels (AUC 70.15% and 74.06%, respectively) were achieved for each of the cognitive task results.
The additional p-value FDR correction method used to minimize the number of false positive p-values resulting from multiple comparisons caused the overall performance to decline based on the AUC. The additional p-value correction might have caused the exclusion of some of the original significant variables in the machine learning step. In accord with our results, a prior study of an EEG-based machine learning algorithm did not utilize an additional correction strategy for the same reason [21].
Classically, the assessment of cognitive function in the elderly was evaluated using neuropsychological tests [2,3]. However, neuropsychological tests tend to be difficult for elderly people because they have to maintain their concentration for a long period to perform the tests properly. Also, physical conditions might be a limiting factor during the examination because the elderly often have poor eyesight and hearing [1]. Hence, it would be beneficial to the elderly if cognitive function could be evaluated using resting qEEG, which can easily and comfortably measure cognition in a short period of time. Resting qEEG parameters are mainly used for the evaluation of childhood attention-deficit/hyperactivity disorder and for predicting childhood IQ [21], which was possible due to the well-established normal data base that reflects neurodevelopment. In the future, using the resting qEEG to predict cognitive function in the elderly in clinical practice needs to consider more than establishing a pediatric database. In other words, the elderly are in a neurodegenerative state, often have medical illnesses, and are often on medication. These factors could affect the EEG results and must be considered when constructing a reliable, normal database for the elderly. The EEG is non-invasive and relatively inexpensive and the current digital EEG is widely available. Thus, increased accessibility will aid in overcoming these barriers if collaborative international research can proceed.
The current results might support the implementation of the system because the classification of the EEG parameters demonstrated potential for use as a preclinical biomarker for the early detection of cognitive decline. Our results confirmed prior reports that EEG changes accurately characterized cognitive decline in patients with AD and mild cognitive impairment [22-26]. Despite the fact that the proposed system could only classify low- and high-performance levels, we achieved EEG characterization using various EEG analysis techniques at the individual subject level using a large data processing system by employing a machine learning algorithm.