INTRODUCTION
A growing body of evidence from ecological, animal, and clinical studies has suggested that neuroinflammation contributes to the pathogenesis of schizophrenia [1-4]. By examining cytokine expression, researchers have postulated several neuroinflammatory theories, including exposures during the prenatal period [5-7], persistent neuroinflammation [8], neuroanatomy alterations [9-11], and cognitive function disturbances [12,13]. However, a variety of cytokines can be expressed under inflammatory stimuli. Examining a limited numbers of cytokines may not give an insight into the complex molecular biology of schizophrenia. In recent years, a bead-based multiplex immunoassay technique (BMIT) for cytokine measurement has been introduced [14], which uses relatively small quantities of sample and brings about much more comprehensive characterizations.
As in first episode schizophrenia, inflammatory abnormalities are noted and suggested to be independent of medication. Evidence therefore suggests an ongoing immune process in patients with schizophrenia, and this population may have a unique inflammatory profile compared to healthy controls [15]. The distinct trajectories of cytokine levels may be indicated to be trait or state markers. Trait markers, like interleukin (IL)-12, interferon-gamma (IFN-╬│), and tumor necrosis factor-alpha (TNF-╬▒) remain elevated despite the treatment. On the contrary, IL-1╬▓, IL-6, and TNF-╬▒ appear to be state markers which return to the baseline level after symptoms of exacerbation were resolved. As a first step in understanding the inflammation in schizophrenia, it would be helpful to investigate the equality between quantitative measurements of inflammatory markers on BMIT, or it would lead to inaccurate estimations and faulty conclusions.
Some authors have recommended using a Bland-Altman plot (BAP) and 95% limits of agreement (LOA) to assess the testretest reliability [16-18]. The graphic approach shows the association of difference in cytokine levels against the mean value of paired measurements for each subject. By constructing an agreement interval with 95% of the differences, a BAP provides more information on the range of variability between measurements for each cytokine.
To date, little data exists on the reliability and agreement of BMIT in measuring cytokine levels. The principle aim of this study is to examine the reliability and agreement of BMIT (17-plex panel) on repeated measurements by using BAPs, 95% LOA, intraclass correlation coefficient (ICC), and coefficient of repeatability (CoR). The secondary aim is to compare the cytokines showing optimal test-retest reliability in patients with schizophrenia with those of healthy controls.
METHODS
Study population
A total of 40 subjects were recruited in Taipei city, northern Taiwan, including 20 patients with schizophrenia and 20 healthy controls. All of the patients were hospitalized in a chronic ward with stable psychiatric condition for more than six months. The control group were enrolled using advertisement, such as leaflets and internet. Patients were interviewed by two certified psychiatrists to confirm the diagnosis of schizophrenia based on the criteria of the Diagnostic and Statistical Manual of Mental Disorders, Fourth Edition, Text Revision [19]. Healthy controls were interviewed as well to exclude a diagnosis of psychiatric disorder. One previous report clearly indicated the confounding effect of body weight index (BMI) on the levels of cytokines and chemokines [20]. Moreover, gender and aging can affect inflammatory profiles [21]. To eliminate potential confounding factors, the study only enrolled male subjects aged from 20-40 years and with BMI <30 kg/m2.
The exclusion criteria were as follows: 1) a history of major medical or neurological disorder; 2) previous head trauma with loss of consciousness; 3) a diagnosis of substance-related disorders; 4) a history of heavy tobacco use or heavy alcohol consumption; and 5) cigarette smoking or alcohol drinking in the most recent three months. Tobacco use and alcohol consumption were not allowed during the study period.
The study procedures were approved by the Institutional Review Board for the Protection of Human Subjects at the Tri-Service General Hospital, a medical teaching hospital within the National Defense Medical Center in Taiwan (TSGH IRB No. 2-103-05-096). Written informed consent was obtained in accordance with the National Health and Medical Research Council guidelines. All participants fully understood the study protocol and all details involved. They were free to withdraw their consent at any time.
Cytokine measurement
Venous blood samples were obtained by venipuncture in the morning between 8:00 and 9:00 AM in fasting status. For the preparation of plasma samples, 10 mL of peripheral blood was drawn into an EDTA-containing Vacutainer Tube and immediately centrifuged to separate the plasma (1,000├Śg at 4Ōäā for 10 min). The samples were then placed into NUNC-cryovial tubes and stored at -84Ōäā. For BMIT assays, thawed aliquots were gently vortexed and then centrifuged at 13,200 rpm for 10 min at 4Ōäā immediately prior to testing. Repeated sampling from healthy controls was performed 14 days later.
The multiplex magnetic bead-based antibody 17-pex panel (Bio-Plex┬« by Bio-Plex ProTM, Catalog #M5000031YV) was used to analyze samples according to the manufacturerŌĆÖs instructions on BMIT analyzers (Bio-Plex 200, Genmall Biotechnology Co., LTD., Taipei, Taiwan). The surveyed cytokines were: IL-1╬▓, IL-2, IL-4, IL-5, IL-6, IL-7, IL-8, IL-10, IL-12, IL-13, IL-17, Granulocyte Colony Stimulating Factor (G-CSF), Granulocyte/Macrophage Colony Stimulating Factor (GMCSF), IFN-╬│, monocyte chemoattractant protein 1 (MCP-1), macrophage inflammatory protein 1-beta (MIP-1╬▓), and TNF-╬▒. Several cytokines are classified as chemokines, including CC chemokines [CCL2 (MCP-1), CCL4 (MIP-1╬▓), and CXCL8 (IL-8)]. Standard curves were created from duplicate values and all samples were analyzed as single determinations. The coefficient of variation was below 10% for intra-assay and below 15% for inter-assay.
Statistical analysis
BAP was drawn, which can quantify agreement in test-retest design. Bias was calculated as the mean of test-retest change values, which is the average test-retest difference. Significant bias was considered to exist if the 95% confidence interval (CI) of bias did not include the value of zero or if the Wilcoxon signed-rank test reached significance. 95% LOA for each test-retest difference was calculated as bias ┬▒1.96├Śthe standard deviation (SD) of the paired difference. Agreement between repeated measurements made on the same subject depends only on the within-subject SD. The range of the upper and lower LOA reflected how far apart the repeated measurements differences were likely to be for most individuals. 95% CIs of upper and lower LOA were calculated by taking each limit plus or minus the product of 1.96 and standard error [22]. CoR referred to as the smallest real difference was calculated as 1.96 ├Ś ŌłÜ2 ├Ś within-subject SD, which can quantify repeatability and reproducibility. ICC was calculated from the proportion of total variability due to between-subject variability. RosnerŌĆÖs interpretation of ICC was applied: ICC <0.40 indicates poor reliability, ICC between 0.40 and 0.75 reflects fair to good reliability, and ICC Ōēź0.75 reflects strong reliability [22]. An ICC of at least 0.55 has been recognized as meaningful and worth further consideration [23].
Group differences in demographic characteristics were analyzed by Mann-Whitney U tests. Data on cytokines were transformed using the natural logarithms for general linear regression analysis. BMI and age were analyzed as covariates for the general linear regression model. Differences between test-retest measurements in cytokines were examined by the Wilcoxon signed-rank test.
All statistical tests were considered significant if the p value<0.05 (two-tailed). All analyses were performed using the Statistical Package for the Social Sciences software for Windows Ver. 19.0 (IBM Corp., Armonk, NY, USA) and Med-Calc Statistical Software version 18 (MedCalc Software bvba, Ostend, Belgium; http://www.medcalc.org; 2018).
RESULTS
Bias with 95% CI
Table 1 displays the baseline and post-test levels of cytokines and bias with 95% CI in healthy controls. The result of repeated measurements by Wilcoxon signed-rank test determined that IL-1╬▓, IL-7, and IL-12 were significantly varied over time, with the greatest difference for IL-1╬▓ (p<0.01). After a 14-day interval, most cytokines did not show significant bias; however, IL-1╬▓, IL-12, and TNF-╬▒ had significant bias, as their 95% CI did not contain the value of zero. The bias was -1.18 to -0.27 pg/mL for IL-1╬▓, -15.52 to -0.87 pg/mL for IL-12, and -6.79 to -0.29 pg/mL for TNF-╬▒.
Reliability and agreement
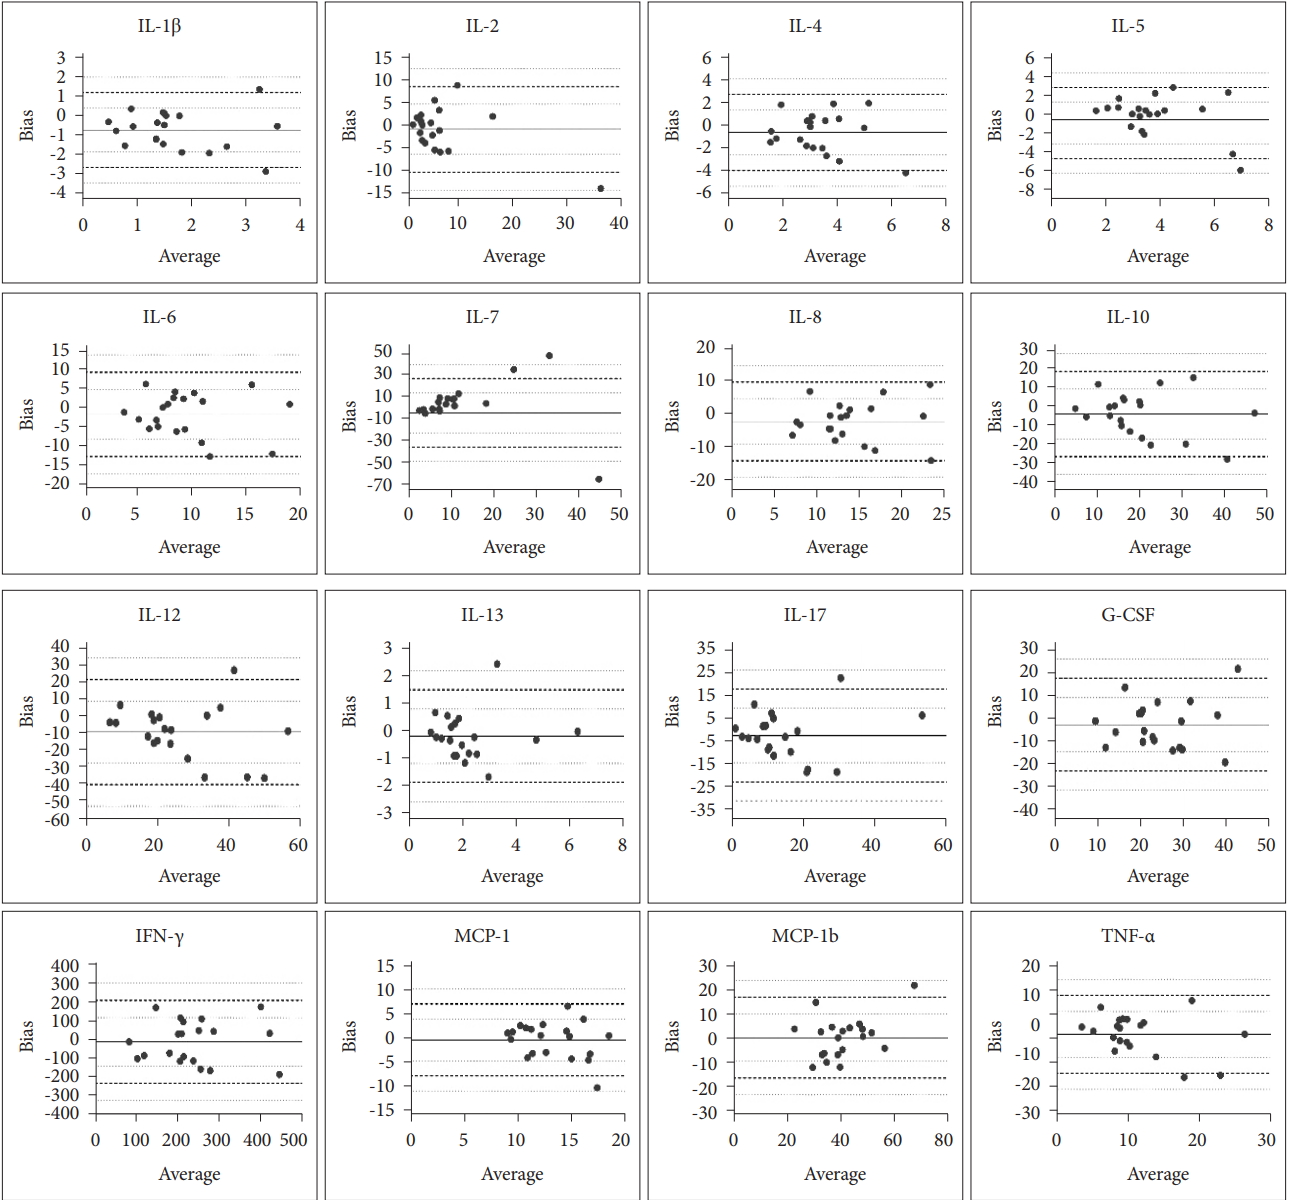
The data of 95% LOA, CoR, and ICC are shown in Table 1. The upper LOA indicates the most likely maximum increase in value on post-test measurement, and the lower LOA shows decrease in value. Considering the ICC, IL2, and IL-13 showed excellent reproducibility (ICCŌēź0.75); IL-10, IL-17, and MIP-1╬▓ exhibited good reproducibility (ICC>0.55); IL-4, IL-6, IL-7, and IL-12 had poor reproducibility (ICC<0.40). The number of outliers is shown in the last column of the table. An outlier is a value exceeding the range of CoR and 95% LOA. Figure 1 illustrates the result of BAP. In each plot, bias and variance are taken into account with respect to the mean value of cytokines which correspond to the vertical line. A total of 14 outliers were noted (14/320=4.37%). The proportion of all cytokines within 95% LOA was 95.63%. Figure 2 illustrates the cytokines that reached between-group significance and did not have significant bias. Patients with schizophrenia revealed dissimilar cytokine expression compared to healthy controls; however, overlapping intervals were evident for IL-4 and IL-13 (Supplementary Figure 1 in the online-only Data Supplement).
Demographic data and baseline levels of cytokines
Table 2 shows the demographic characteristics and baseline levels of cytokines. Compared with healthy controls, patients with schizophrenia were significantly older, and their BMI was significantly larger. Of the 17 cytokines, most data on GM-CSF were under the lower limit of detection and were excluded from the final analysis. The dispersion of cytokine levels was large for patients with schizophrenia and healthy controls. For example, in healthy controls, the mean of IL-7 was 11.28 pg/mL, while its SD was 15.77 pg/mL; in patients with schizophrenia, the mean of TNF-╬▒ was 50.16 pg/mL, while its SD was 101 pg/mL. Considering between-group differences, patients with schizophrenia had significantly higher levels of IL-5, IL-13, and TNF-╬▒, and significantly lower levels of IL-4, IL-12, and IFN-╬│.
DISCUSSION
This study showed that by using BMIT for cytokine measurement, the within-subject cytokine variation was large, making the test-retest reliability suboptimal by testing ICC. When using BAPs with 95% LOA, most cytokines had acceptable test-retest reliability; only 4.37% of cytokine data were considered outliers, and only three cytokines showed significant bias. Although most cytokine expression in patients with schizophrenia was distinct from that of healthy controls (Supplementary Figure 1 in the online-only Data Supplement), the large within-subject and between-group variation in cytokine levels led to only four cytokines showing optimal test-retest reliability and reaching between-group differences.
A previous study used ICC to examine the test-retest reliability of BMIT in measuring cytokine levels in healthy individuals and patients with major depression. However, the authors found that the levels of cytokines varied differently in health participants during a 30-week interval [24], implying suboptimal test-retest reliability of BMIT. Importantly, ICC is the fraction of the total variance attributed to between-subject variability [16,17]. Assuming that there are no systematic biases, ICC is affected primarily by heterogeneity of subjects [22,25]. However, if within-subject variability is comparable to or even larger than between-subject variability, the degree defined by the ICC becomes meaningless. In other words, if the normal range of cytokine levels varies significantly on repeated measurements in the same individual, ICC is not an appropriate indicator of between-subject differences, as the within-subject variance may be larger than the between-subject variance. By using BAPs to assess the test-retest reliability of BMIT, a large proportion of cytokine data were still within 95% LOA without significant bias. This means that future research using a larger sample size can help reframe representative levels for each cytokine, and the results of BMIT for cytokine measurement can determine reliable biomarkers for exploring the link between psychiatric disorders and the inflammatory process.
Our findings support optimal test-retest reliability for several cytokines assayed by BMIT, including IL-2, IL-4, IL-5, IL-6, IL-7, IL-8, IL-10, IL-13, IL-17, G-CSF, GM-CSF, IFN-╬│, MCP-1, and MIP-1╬▓. For these cytokines, the lines of equality (zero) were within 95% CI of bias, implying reliable agreement over a 14-day test-retest interval. However, the difference of retest on IL-7 needs to be emphasized, as the CoR was relatively large (31.58, 95% CI: 24.16 to 45.61 pg/mL), and the Wilcoxon signed-rank test reached significance. On the other hand, IL-1╬▓ and IL-12 appeared to have larger intraindividual variation than those of other cytokines, as both cytokines showed significant cytokine changes on retest and significant bias on BAPs. This means that the results from cross-sectional studies assessing the levels of IL-1╬▓, IL-7, and IL-12 may be unreliable. Previous studies compared the immunoassay results between an enzyme-linked immunosorbent assays (ELISA) and BMIT for cytokine measurements, revealing robust correlations for IL-1╬▓, IL-7, and IL-12 [26,27]; however, whether these cytokines could reach optimal test-retest reliability remains unknown. The results from our study suggest that even in healthy controls, these cytokines may respond to the external environment in a very sensitive way, resulting in large intraindividual variation in cytokine levels [24,26].
The ICC for IL-4 (0.35), IL-6 (0.36), and IL-7 (0.03) in our study showed discrepancy from those of a previous study in which ICC was larger than 0.90 over a 30-day interval [24]. By definition, ICC represents interindividual variability relative to total variability. Because the within-subject variation in cytokine levels was large in healthy controls, the lower ICCs in our study suggest that within-subject variability may be larger than between-subject variability, constituting a small ratio of between-subject variability over total variability. BAPs with 95% LOA can help address how far apart the true repeated measurement differences were likely to be on BMIT for cytokine measurements. For example, the ICC was 0.35 for IL-4, indicating poor differentiating ability. Using BAPs with 95% LOA, the upper LOA was 2.87 pg/mL and the lower LOA was -3.9 pg/mL. This means that the changes in IL-4 levels on retest measurement ranged from -3.9 to 2.87 pg/mL. The value of CoR was 3.45 pg/mL for IL-4, which also represented the measurement error or the smallest possible change on repeated measurements by BMIT.
In the current study, patients with schizophrenia had significantly higher levels of IL-5 and IL-13, and significantly lower levels of IL-4 and IFN-╬│, which appeared not to support the schizophrenia theory of T helper (Th)2 shifting (IL-4, IL-5, and IL-13,) and blunted Th1 (IL-2, IL-12, INF-╬│, and TNF-╬▒). A meta-analysis reported significant decrease in IFN-╬│ levels in a chronic schizophrenia subgroup with a large effect size (HedgeŌĆÖs=-1.07), which was consistent with our findings [28]. However, another study found that IFN-╬│ levels did not change with clinical severity, and suggested that INF-╬│ is a trait marker that continually increased expression in the disease course [8]. IL-5 and IL-13, as ant-inflammatory cytokines produced by Th2 cells, were inclined to increase in our study. On the other hand, in our study, IL-4 was lower; however, Goldsmith et al. [28] and OŌĆÖBrien et al. [29] have found IL-4 to be associated with acute schizophrenia episodes. The discrepancy between our study and the previous meta-analyses can be explained by the heterogeneity of the included studies in the meta-analyses. For example, the inclusion criteria did not distinguish studies which collected serum samples from plasma. However, plasma levels of cytokine measurements have been reported to be higher than the serum levels [24,30-32]. Moreover, these studies did not address limitations of the standard assays, such as the multiplex system or ELISA based system, and previous evidence has revealed discordant results between these methods which may result in substantial heterogeneity while conducting meta-analysis [28,33].
A strength in our study is that we have confirmed the test-retest agreement for numerous important cytokines on BMIT using plasma samples, which can assist further research in exploring these cytokine biomarkers or performing meta-analytical work. However, our findings should be interpreted carefully with consideration of the following limitations. First, our sample size was small, so the 95% LOA and 95% CI of bias were wide. For example, in the levels of IFN-╬│, the Wilcoxon signedrank test did not show significant difference on the repeated measurement and the BAP did not determine a significant bias; however, the CoR of IFN-╬│ was 218.06 pg/mL, with 95% CI ranging from 166.83 to 314.90 pg/mL. Another limitation is that we did not stratify the patient groups by clinical features or treatments due to the small sample size. A previous metaanalysis has analyzed the cytokine differences by subgrouping into first-episode psychosis and medicated patients to eliminate the effects of psychotropics [8]. Third, a small sample size may increase within-subject variation in cytokine expression. Fourth, although we found agreement on cytokine measurements by BMIT, the participants in our study were homogenous in nature. A larger study can stratify different patient groups by clinical features or treatments and analyze subgrouping BAP with 95% LOA, which can provide deeper insight into cytokine variation and define their reference range.
In conclusion, this study provides evidence that BMIT has good reproducibility and test-retest reliability on cytokine measurements. Patients with schizophrenia demonstrated aberrant cytokine expression compared to healthy individuals, and their inflammatory profiles can be distinguished by selecting reliable cytokines. Currently, the use of cytokines as potential disease markers is still limited. Knowledge of the stability of plasma cytokines levels based on BMIT will help researchers to better delineate inflammatory profiles between different populations.