INTRODUCTION
Depression is a heterogeneous and etiologically complex psychiatric syndrome [1-3], and its pathophysiology is still unclear.
Iron, an essential microelement in the body, plays important roles in physiological functions and the development of human brain, including oxygen transport, DNA synthesis and repair, electron transport, and neurotransmitter metabolism [4,5]. Decrease of iron not only result in the accumulation of monoamine oxidase that significantly reducing catechol transmitters, but also preventing the degradation of serotonin and decreasing the density and activity of dopamine [6]. On the other hand, excessive iron deposition can prevent dopamine synthesis by inducing toxic free radicals, which is involved in emotional and cognitive processing [7,8]. Although these reports have suggested the abnormal iron might influence the metabolism of depression related neurotransmitters from the side, the relationship between iron and depression is still lack of direct evidence in vivo.
Magnetic resonance imaging (MRI) has been regarded as one of the most powerful methods of neuroscience in vivo for non-invasive detection of brain tissue structure, function and metabolism [9,10]. Using the sequences of T2 or T2*, brain iron have been detected in several neuro-diseases; however, these results were limited by significant technical deficiencies— non-quantitative measurement, in which phase signal was easily affected by the formation of the magnetic field distribution because of the nonlocal nature of the magnetic field distribution [11]. Quantitative susceptibility mapping (QSM) is an independent of field strength and object shape imaging that has been considered to be the optimum quantitative detection for brain iron [12,13]. The successful application of this imaging technology in diseases (Huntington’s disease, Parkinson’s disease [PD], etc) makes it possible to study the brain iron of patients with depression [14,15].
Here, using QSM measure and voxel-based analyses, the objective of this study was to systematically investigate the changes of brain iron deposition in the whole brain and regions of interest (ROIs) of depressed patients, and to assess the relationships between susceptibility and depression-related conditions.
METHODS
Subjects
Basing on the results from the Chinese version of the Modified Structured Clinical Interview for Diagnostic and Statistical Manual of Mental Disorders (4th ed), twenty-one recurrent depression patients were recruited from the department of neurology and psychiatry. Inclusion criteria for enrollment included no previous history of neurological diseases, tumors, cerebral microbleeds, major cardiovascular risk factors, chronic diseases, or head injuries. All subjects were scanned by 3T MR at baseline before treatment and follow-up after treatment (depressive symptoms disappeared, Hamilton Depression Rating Scale [HDRS]≤8), and received extended diagnostic examinations, including a review on clinical history, and a 24-item HDRS assessment. Additionally, according to the inclusion criteria, twenty healthy control subjects (matched for age, sex, education, and handedness) were also recruited. Group demographic details are summarized in Table 1. All the examinations were performed with the understanding and written consent of each subject, with approval from the ethics committee of The First People’s Hospital of Lianyungang (LYG-20180438), and in compliance with national legislation and Declaration of Helsinki guidelines.
Image acquisition
All images were acquired using a Siemens Magnetom Trio 3.0T scanner with a 16-channel head coil (Siemens Corp, Erlangen, Germany). T1-weighted 3D-MPRAGE anatomical images were also collected to independently resolve the underlying brain anatomy. The imaging parameters were as follows: repeat time (TR)=14 ms with echo time (TE)=4.92 ms, slice thickness=1 mm, flip angle=7°, bandwidth/pixel=140 Hz/pixel, voxel resolution=1×1×1 mm3, field of view (FOV)= 25 cm, matrix size=256×256×192, scan time=3 min 20 seconds, and parallel imaging factors=2. T2-weighted images were also acquired with turbo spin-echo for visual inspection to exclude brain abnormalities. The imaging parameters were as follows: TR=5,400 ms with TE=110 ms, slice thickness=2 mm, flip angle=150°, bandwidth/pixel= 40 Hz/pixel, turbo factor= 18, voxel resolution=1×1×2 mm3, FOV=25 cm, matrix size= 256×256, scan time=2 min 40 seconds, and parallel imaging factors=2. Gradient-recalled echo (GRE) data were collected as complex MRI signals from each receiver channel. The imaging parameters were as follows: TR=28 ms with TE=16 ms, slice thickness=2 mm, flip angle=7°, bandwidth/pixel=120 Hz/pixel, voxel resolution=1×1×2 mm3, FOV=25 cm, matrix size=256×256×80, and scan time=5 min and 10 seconds. To minimize motion and increase inter-subject reproducibility in positioning, a thin pillow was placed on the base of the coil surrounding the sides and back of the head.
Data preprocessing
The magnitude images were projected with the BET algorithm (threshold setting 0.2) in the FMRIB Software Library (FSL) v5.0.9 (http://fsl.fmrib.ox.ac.uk/fsl/fslwiki/) to generate brain masks [16]. Phase images were unwrapped with the Laplacian approach [17]. Applying the method of sophisticated harmonic artifact reduction on phase data filtering, the background field was removed using a kernel size with a maximum radius of 6 mm and a singular value decomposition threshold of 0.05 [11]. Finally, an iterative algorithm was used to generate QSM images [18]. As previous study suggested that reference normalization is only of a small adjustment [19], susceptibility was not adjusted with a reference region in this study. The original susceptibility maps were derived from the following equation (for a left-handed system) [20]:
wherein, Pcor is the phase distribution of the unwrapped and background-field-corrected phase map; γ is the gyromagnetic ratio for hydrogen protons; B0 is the main magnetic field strength; TE is the echo time; and kx, ky, kz, are coordinates in k-space.
Spatial standardization
To align pixels to the same anatomical position in the brains of different subjects, the following post-processing steps were performed using a Statistical Parametric Mapping Version 8 (SPM8) program (http://www.fil.ion.ucl.ac.uk/spm), which was run on matrix laboratory (MATLAB) 2013a (https://www.mathworks.com/products/matlab.html): The individual high-resolution MPRAGE-T1WIs were initially normalized to Montreal Neurological Institute (MNI), and co-registered to the QSM image after motion correction using a linear transformation. Then, the co-registered QSM images were normalized to MNI space using the normalized parameters of the MPRAGE-T1WIs. Applying the smoothing-compensation strategy proposed by a previously study [21], 3D Gaussian kernel (3 mm) was performed for correcting co-registration errors and other imperfections.
Regions of interest extraction
ROIs were extracted bilaterally in FSL according to the BN_Atlas_274_noCb_uint16 template (https://scalablebrainatlas.incf.org/human/BNA) [22]. In order to reduce the marginal effects caused by standardized defects and registration errors, ROIs were eroded in 3D by convolution with a 1-mmradius spherical kernel. Mask overlays were checked to ensure that all masks excluded spurious voxels. The iron concentration in postmortem samples as reported by Hallgren and Sourander23 was used to validate whether QSM data provided a reliable quantitative measure of iron.
Statistical methods
Whole-brain (depression versus control) permutation analysis was conducted with the Statistical nonParametric Mapping toolbox (SnPM) in SPM8. Significant clusters were determined with 20,000 data permutations. A significance level of p=0.005 was applied with correction for multiple comparisons using the family-wise error (FWE) (p<0.05) method and clusters with at least 10 contiguous voxels. As a large number of previous studies have confirmed the positive effects of demographics (age, sex, medication, and so on) on iron content in the brain, these covariates were adjusted in group comparison [24]. After analysis, the study results were warped to MNI space and viewed in XJVIEW software (http://www.alivelearn.net/xjview).
Wilcoxon rank-sum tests were used to show interhemispheric differences. Then, averaged susceptibility of ROIs was used for comparison on tissue iron data, and averaged median susceptibility of ROIs across hemispheres were computed to improve measurement stability. Moreover, depressionversus-control Wilcoxon rank-sum statistics were computed (pBonferroni<0.05). The change of susceptibility before and after treatment in the depression was detected by paired t test. In addition, Pearson correlation test (median ROI susceptibility with symptom severity-HDRS, relapse frequency, mean duration of single episode, and total course of disease onset) was also computed, and linear least-square fits were calculated for regions where the Pearson correlation test returned a significant result. All tests were performed as two-tailed test.
RESULTS
Individual comparison
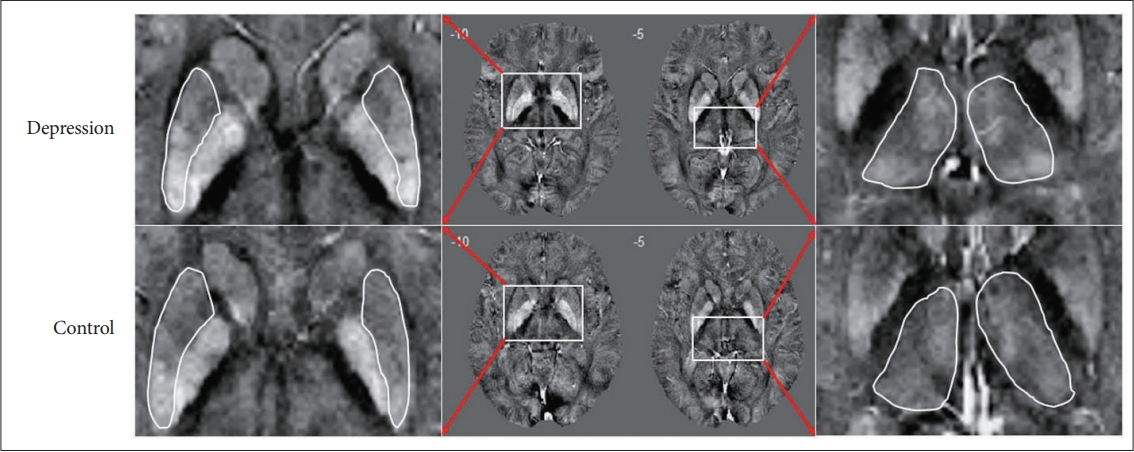
Definite iron deposition in the brain were found in the basal ganglia and other deep-brain nuclei (the globus pallidus had a highest susceptibility), which were not so remarkable in the cortex. Moreover, the venous system and some small scattered signal inhomogeneities were found in maps. In addition, comparing with the controls, patients with recurrent depression showed significantly increased susceptibilities in the bilateral putamen and thalamus (Figure 1).
Whole-brain quantitative susceptibility mapping study
The whole-brain group results revealed that iron deposition under depression is spatially selective (Figure 2). Besides, the whole-brain QSM results revealed widespread absolute susceptibility increases in patients with depression, which involved both the cerebellar and cerebral structures (FWE corrected p<0.05). Largely bilateral abnormalities were found in the frontal lobes, temporal lobe structures, occipital lobes hippocampal regions, putamen, thalamus, cingulum, and cerebellum of the patient group.
Regions of interest extraction and validation
The average susceptibility of ROIs from the control group in this study was compared with the iron concentration in postmortem samples as reported by a previous study [23]. Although there were significant differences between the two groups that might be attributable to some objective reasons (the former was dominated by ferritin macromolecules, myelin, blood, calcium and trace elements; the latter was dominated by non-haemin iron), a linear regression was then applied to find the correlation between susceptibility values of controls in the present study and iron content in postmortem samples from Hallgren and Sourander [23], and a significant correlation (r=0.783, p<0.001) was found in the frontal lobe, temporal lobe, occipital lobe, cerebellum, putamen, and thalamus (Supplementary Figure 1 in the online-only Data Supplement).
Regional quantitative susceptibility mapping study
Regional QSM study showed that left/right measurements were comparable across controls and patients with depression in both the deep gray matter (DGM) structures and cortex (all p>0.140). Compared with the control group, the depression group showed significantly increased regional susceptibility in the frontal lobe (Z=3.6, p<0.001), temporal lobe (Z=4.2, p<0.001), occipital lobe (Z= 4.3, p<0.001), hippocampus (Z=3.0, p=0.007), putamen (Z=3.4, p<0.001), thalamus (Z=3.3, p<0.001), and cingulum (Z=2.3, p=0.01), as well as in the cerebellum (Z=2.8, p=0.004) (Supplementary Figure 2 in the online-only Data Supplement).
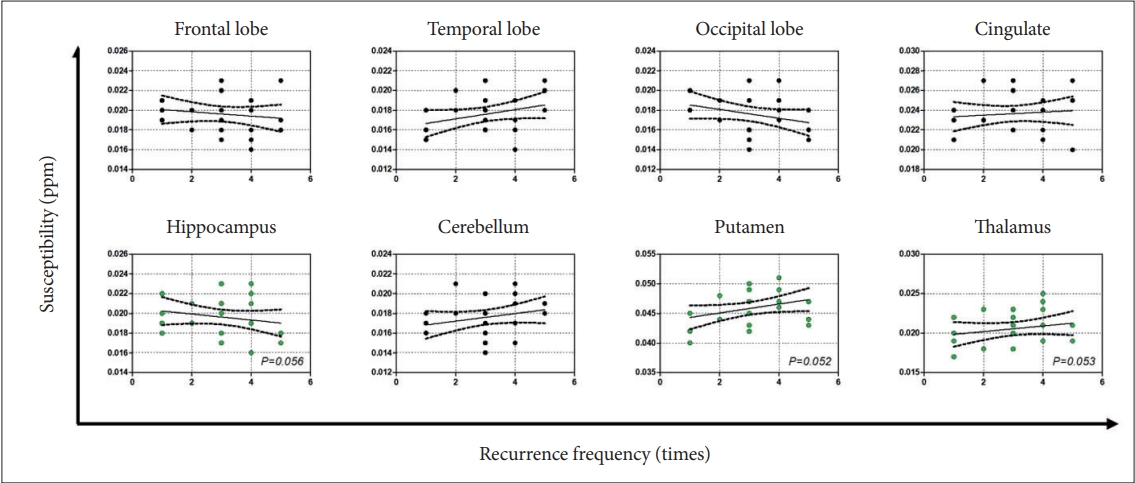
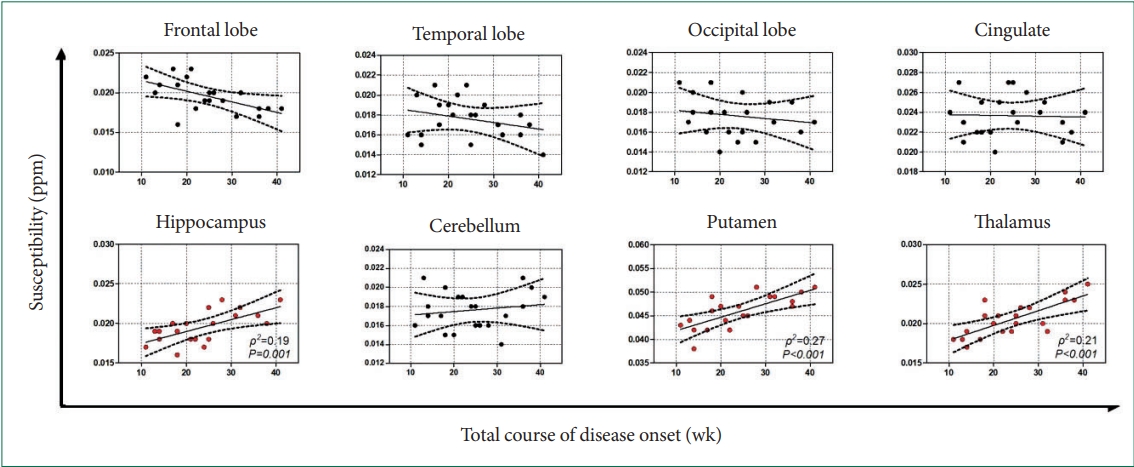
Although HDRS showed significant differences before and after treatment (t=16.295, p<0.001), there was no susceptibility change was found in the involved brain regions (Supplementary Table 1 in the online-only Data Supplement), and no significant correlation between HDRS and susceptibility was found (all p>0.05). Subsequent results revealed a nearly statistically significant association between the relapse frequency and the susceptibility in the putamen, thalamus, and hippocampus (Figure 3), and similar results were also found in the analysis of mean duration of single episode (Figure 4). Further studies showed that susceptibility across the putamen (ρ2=0.27, p<0.001), thalamus (ρ2=0.21, p<0.001), and hippocampus (ρ2=0.19, p<0.001) were strongly correlated with the total course of disease onset (Figure 5).
DISCUSSION
This study was the first to report the relationships between brain iron deposition and multiple factors associated with depression (treatment, symptom severity-HDRS, relapse frequency, mean duration of single episode, and total course of disease onset). Our study discovered widespread increased susceptibility across the basal ganglia and cortex in depression, which could not be reversed by treatment. More important was the finding that susceptibility across the putamen, hippocampus, and thalamus were strongly correlated with the total course of disease onset, but not the severity of depressive status-HDRS. It is suggested that brain iron deposition may be a cumulative marker of brain damage in depression, but not an immediate indicator of symptoms.
Before the QSM method was successful developed [25,26], there were two types of methods to detect iron in the brain, i.e., qualitative MRI methods (T2 [27], T2* [28], R2* [29], susceptibility weighted imaging [SWI]) [30], and semi-quantitative MRI methods (magnetic field correlation imaging [31], phase imaging) [32]. However, all the above-mentioned methods are essentially based on the characteristics of the magnetic field, which may cause blooming artifacts [33,34], so the traditional MRI quantification methods do not provide an absolute quantification and are under the effect of non-local influences [35]. Compared to the traditional techniques, QSM is believed to be able to give a more accurate and specific measurement on tissue magnetic susceptibility [36,37]. This susceptibility can be calculated using a map of the resonance frequency in each voxel, which traditionally utilizes the MR phase signal from GRE imaging and has been shown to correlate well with tissue iron concentration in most gray matter regions in the brain [38].
As iron deposition in the brain is spatially selective (significant brain iron deposition was found in the basal ganglia and other deep-brain nuclei), these ROIs are usually subjectively chosen, artificially outlined, extracted, and analyzed directly in most previous MRI researches. In fact, there are two major deficiencies with this strategy. First, it usually ignores the changes in the most important structure of the brain (the cortex). Abnormal deposition of iron in the cerebral cortex has been proved in vitro by other established methods, such as histochemical analysis, staining or transcranial sonography. Second, the extraction of artificially outlined ROIs is subject to two definite limitations: i) results are generally prone to inaccuracies in ROI definition due to the intricate anatomical substructures and weak contrast of anatomical boundaries on QSM; and ii) the poor consistency of repeated measurements depending on subjective outlining might cause a groupdependent study bias. In need of special is that, although ROIs extracted according to the MNI-template in FSL could overcome the above deficiencies, there was still limitation of the method adopted in this study that the registration might be not perfect because of lost or mixed image information.
In our study, consistent results from both a whole-brain and regional QSM study showed that brain regions with abnormal susceptibility in patients with depression included the frontal lobes, temporal lobes, occipital lobes, hippocampal regions, putamen, thalamus, cingulum, and cerebellum. We found it interesting that increased brain iron deposition occurred not only in two iron-rich areas (not all iron-rich brain areas were involved), but also in areas with minimal iron content (cortex, hippocampus, and cerebellum). This phenomenon was also reported in previous QSM whole-brain studies of iron deposition in PD and multiple sclerosis patients [19,24]. Although its intrinsic mechanism remains unclear, this distribution pattern of aberrant brain iron deposition is enough to draw our attention and strongly suggest that studies on iron in the brain should not be focused merely on DGM. So far, direct evidence of the relations between iron deposition patterns in the brain and depression has been exhibited in this study. In fact, regions of aberrant brain iron deposition we reported here were consistent with those reported by structural and functional MRI studies of depression [39,40]. That is, in a state of stress or depression, brain iron deposition may be one of physiological and pathological changes, with synergistic effects on the structure and function of the sensitive brain regions.
In subsequent analysis, we found the susceptibility in the involved brain regions could not be reversed by treatment, and was not correlated with the severity of depressive status-HDRS. The results were slightly different from the previous reports [41], which might be explained by two reasons: 1) different sample populations and 2) different methods of brain iron deposition analysis. Our further results found that not only the susceptibility in the putamen, thalamus and hippocampus presented a nearly statistically significant association with the relapse frequency and mean duration of single episode, but also a strongly correlated with the total course of disease onset. In fact, the relapse frequency and mean duration of single episode were the two determinations of the total course of disease onset. We believed that these three factors should be all closely related to the brain iron deposition in the above brain regions, and “a nearly statistically significant” might be attributed to the limited sample size in this study. Besides, it was not surprising to find that these regions of brain iron deposition were associated with the depressionrelated conditions, as previous studies had revealed that the putamen (part of the striatum) is related to motor and cognitive functions [42], and its dysfunction is known to be associated with loss of dopaminergic neurons within the corticalstriatum-thalamocortical circuit [4]. The thalamus is thought to be involved in the pathophysiology of depressive disorders and is currently drawing sustaining attention [43], and a recent research has reported that abnormal thalamocortical connectivity was found in depression [44]. Another brain region involved was the well-studied hippocampus, which has always been regarded as a targeted area in depression research because of its important role in emotion, cognition and memory. In general, brain iron deposition in the specific brain regions may be a cumulative marker of brain damage in depression, but not an immediate indicator of symptom.
We sincerely apologize for the shortcomings of the paper. 1) A limited sample size in this study could lead to statistical errors of type I and II. 2) We had not adopted a finer scale for the selection of cortical interest areas. 3) This study did not have sufficient follow-up to understand the further evolution of brain iron deposition in depression.
In conclusions, brain iron deposition is related to the total course of disease onset, but not the severity of depression, which suggest that brain iron deposition may be a sign of brain damage in multiple recurrent depression.