INTRODUCTION
Obsessive-compulsive disorder (OCD) is a relatively common clinically refractory mental disorder characterized by repetitive invasive thoughts and/or repeated ritual behavior [1]. Patients are aware that it serves no purpose but are unable to get rid of it, negatively impacting their quality of life and social adaptability [2,3]. According to recent data, the prevalence of OCD is increasing, with more than 80 million people worldwide suffering from the disorder, most of whom do not benefit from existing treatments [4]. Its etiology and pathogenesis have been studied for more than half a century. OCD is influenced by both heredity and the environment, with abnormal brain structure and cognitive defects; genetic factors are the primary cause of pathogenesis [5-9]. There are currently few indepth studies on the pathogenesis of OCD.
The main hypothesis of this study was that the molecular signaling pathways associated with OCD are dysfunctional, leading to the expression of symptoms. Our goal was to identify key genes and signaling pathways involved in the pathogenesis of OCD by integrating and analyzing sequencing data from two datasets. These genes and pathways can provide insights into the molecular mechanisms underlying OCD pathogenesis, supporting the development of new treatment strategies.
METHODS
Ethics statement
This study was approved by the human ethics committee of the General Hospital of Ningxia Medical University, and each participant provided written informed consent (ethical approval number: 2020-231).
Sequencing datasets
Sequencing datasets related to human OCD were searched in the PubMed Gene Expression Omnibus (GEO) database (https://www.ncbi.nlm.nih.gov/). As there were few datasets related to OCD, the screening condition was determined to include all datasets containing samples with OCD. The source of the sequencing samples was human peripheral blood or brain tissue samples from human autopsy, and the sequencing item was mRNA. Two available datasets, GSE78104 and GSE60190, were obtained by filtering. In the GSE78104 dataset, mRNA sequencing was performed on the peripheral blood of 30 patients with OCD and 30 healthy controls. In the GSE60190 dataset, the brain tissues of 16 patients with OCD and 102 healthy controls were sequentially analyzed. Each dataset measured the differentially expressed genes (DEGs) in OCD.
Intersection of genes from GSE78104 and GSE60190 datasets
The GSE78104 and GSE60190 datasets were downloaded from the GEO database, the difference multiple was set as Ōēź2, and the DEGs in OCD were screened. The DEGs in these two datasets were intersected to obtain genes with abnormal expression in OCD for subsequent analysis. The Venn mapping tool on the bioinformatics online analysis website (http://www.bioinformatics.com.cn) was used to find intersecting genes.
Kyoto Encyclopedia of Genes and Genomes and Gene Ontology enrichment analyses
Kyoto Encyclopedia of Genes and Genomes (KEGG) and Gene Ontology (GO) classification enrichment analyses were performed using the Database for Annotation, Visualization, and Integrated Discovery (DAVID) online analysis site (https://david.ncifcrf.gov/tools.jsp) to determine which signaling pathways the intersecting DEGs were enriched in and the biological processes (BPs) they participated in. First, the DEG list was uploaded to the ŌĆ£UploadŌĆØ module, and Homo sapiens was chosen as the species for analysis. The website filters unrecognized genes and selects the items to be analyzed. For the analyses, the KEGG pathway, GO cellular component (CC), GO BP, and GO molecular function (MF) projects were selected. After the analysis results had been generated, they were downloaded to the local computer in .txt format to be classified and summarized.
Drawing KEGG signal pathway, GO analysis, and Gene Set Enrichment Analysis diagrams
After classifying and summarizing the downloaded DAVID analysis results, we used a bioinformatics online mapping website (http://www.bioinformatics.com.cn) to visualize the enrichment results for the KEGG signaling pathway, GO classifications, and Gene Set Enrichment Analysis (GSEA) diagrams. The DAVID analysis results were rearranged based on the drawing requirements from the website. The rearranged data were uploaded to the data input module, and the image generation parameters were set. After that, the images were mapped and saved at various resolutions.
Protein-protein interaction correlation network analysis and Molecular Complex Detection gene screening
We used the Metascape online analysis website (https://metascape.org/) to analyze the protein-protein interaction (PPI) association network of different genes and screen the key genes using Molecular Complex Detection (MCODE) to determine whether there was a correlation among the many different genes, whether it was possible to classify them, to identify key genes of different categories, and further refine the signaling pathways in which different genes were located. As the number of differential genes surpassed 3,000, exceeding the analytical capacity of the Metascape website, genes with p-values Ōēż0.05 among the DEGs were screened for PPI analysis. The selected DEGs were uploaded to the Metascape website, and the species were selected for online analysis. The genes obtained from the MCODE module analysis were downloaded, and KEGG signaling pathway enrichment and GO analyses were repeated to better understand the specific signaling pathways that may influence the onset of OCD, as well as the key genes involved in these signaling pathways.
RESULTS
Initial analysis of genes from the GSE78104 and GSE60190 datasets
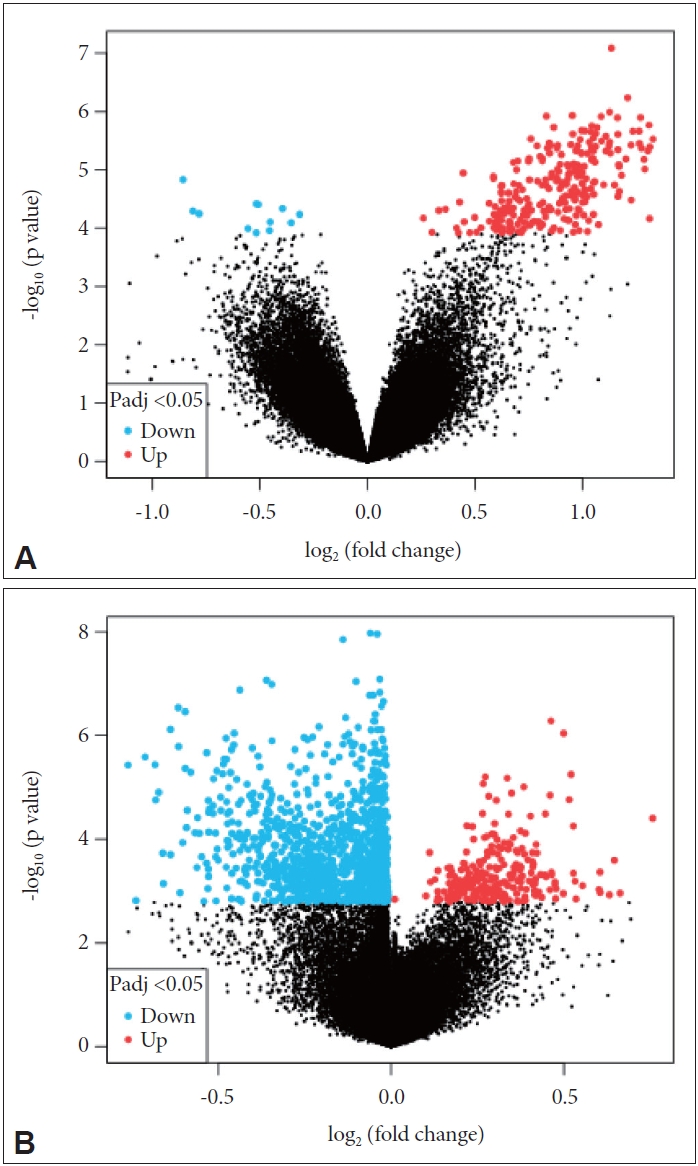
First, a volcano map comparing the genes in each dataset was generated (Figure 1). We found that in the GSE78104 dataset, more genes were upregulated in OCD patients, whereas more genes were downregulated in the other dataset.
To identify common DEGs in patients with OCD from both datasets, the data was intersected. After intersection, 3,449 common DEGs were identified (Figure 2).
KEGG analysis of intersected DEGs
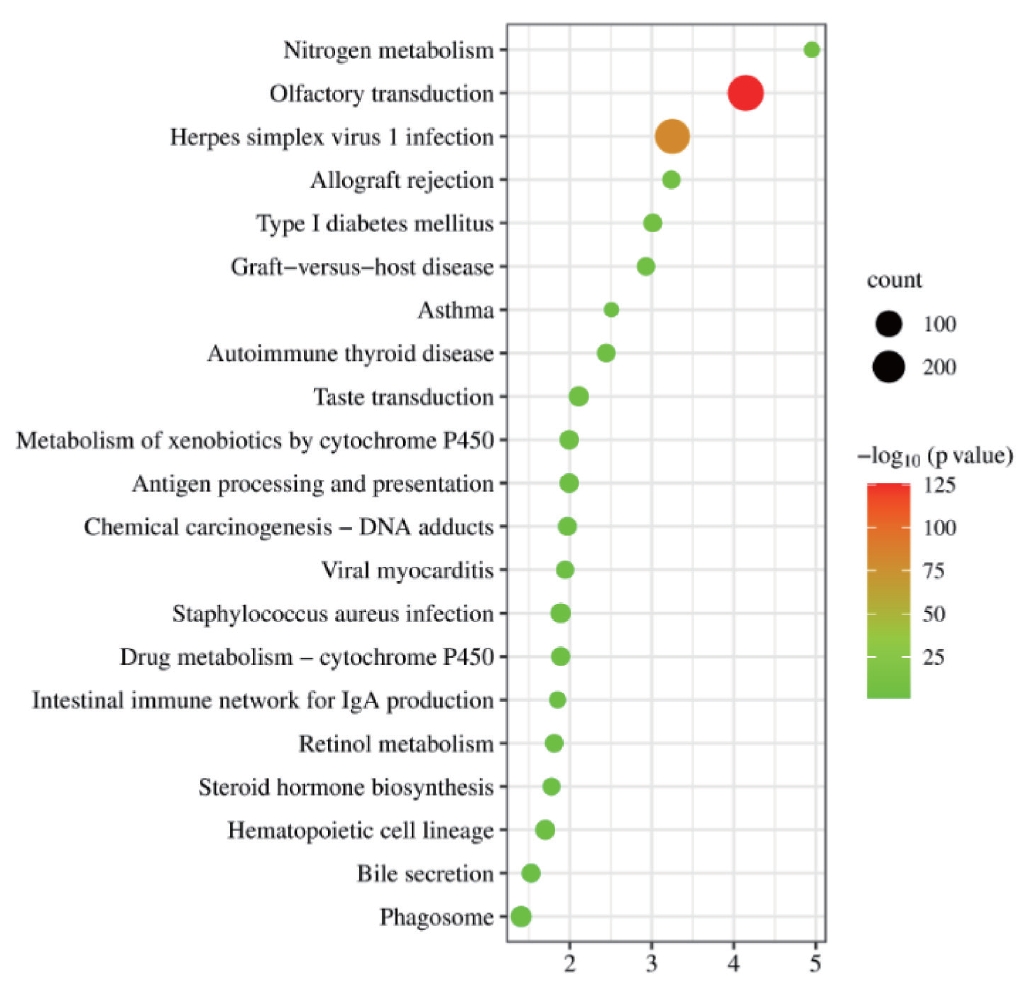
KEGG analysis was conducted on intersecting genes, and it was found that they were mainly concentrated in the olfactory transduction-related and herpes simplex virus type 1 infection-related pathways (Figure 3).
GO enrichment analysis of intersecting DEGs
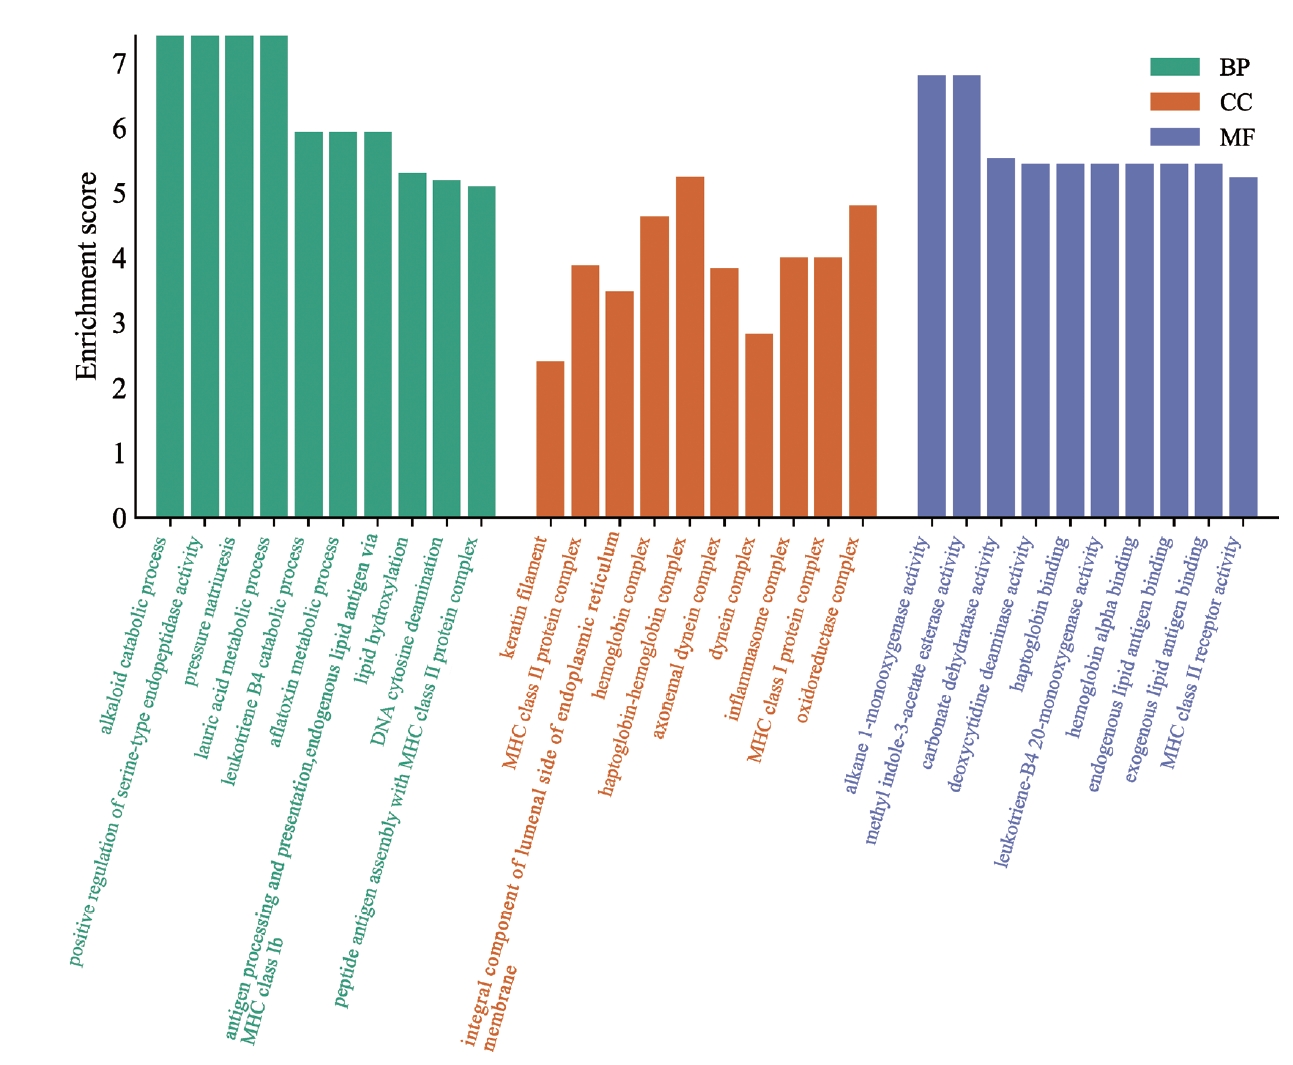
GO enrichment analysis was performed on the intersecting genes from the two datasets (Figure 4). The genes were mainly enriched in alkaloid metabolism, urinary sodium excretion, and lauric acid metabolism processes in the human body. The main CCS enriched by these intersecting genes were the globin-hemoglobin complex, REDOX enzyme complex, and hemoglobin complex. The biological functions of these DEGs were related to the activity of alkane monooxygenase, carbonate dehydrase, and endogenous methyl acetate. This suggests that these DEGs are involved in metabolic processes and hemoglobin production in the human body, and it is possible that patients with OCD exhibit metabolic changes.
PPI network analysis of intersecting DEGs
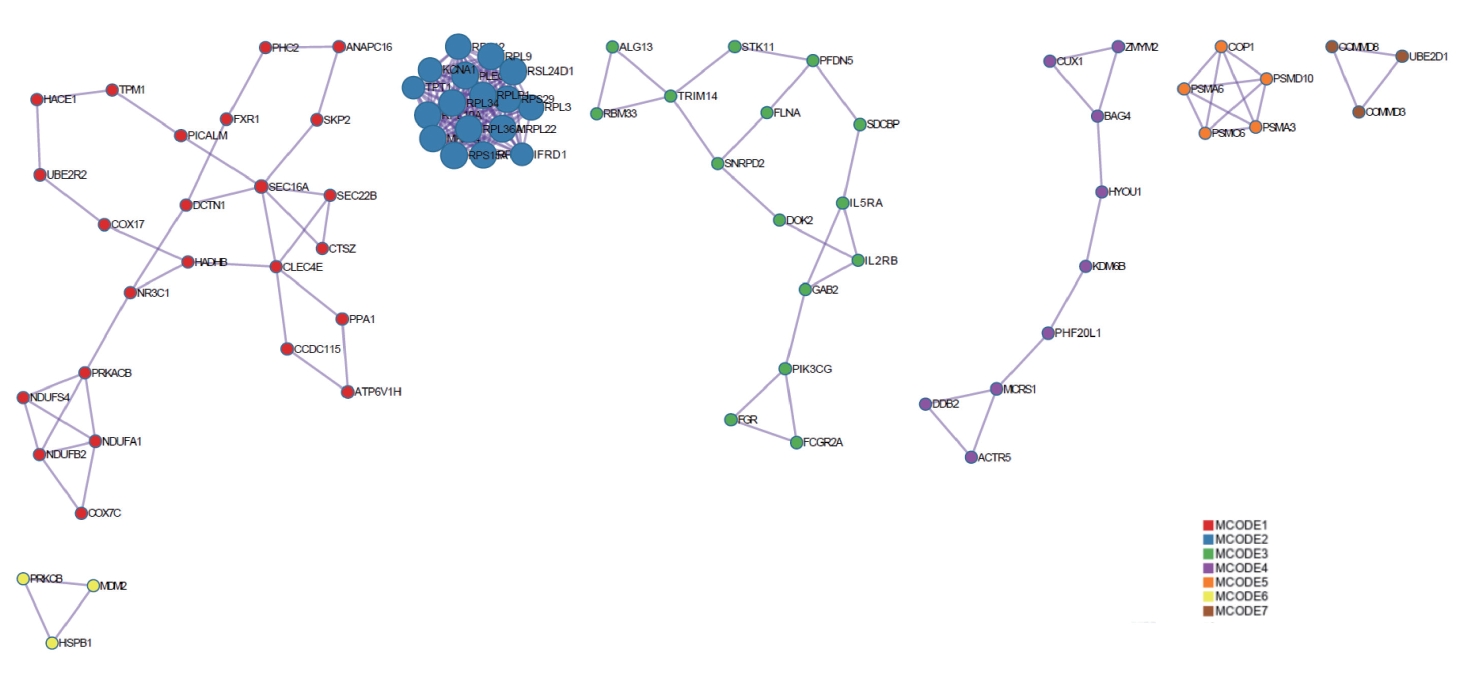
The KEGG and GO analyses of the DEGs was rather general. To determine whether the DEGs had the characteristics of aggregation distribution and whether they were specifically distributed in different signaling pathways, PPI analysis was conducted on the DEGs. The DEGs were mainly divided into seven interrelated gene clusters, five of which contained more than three genes (Figure 5).
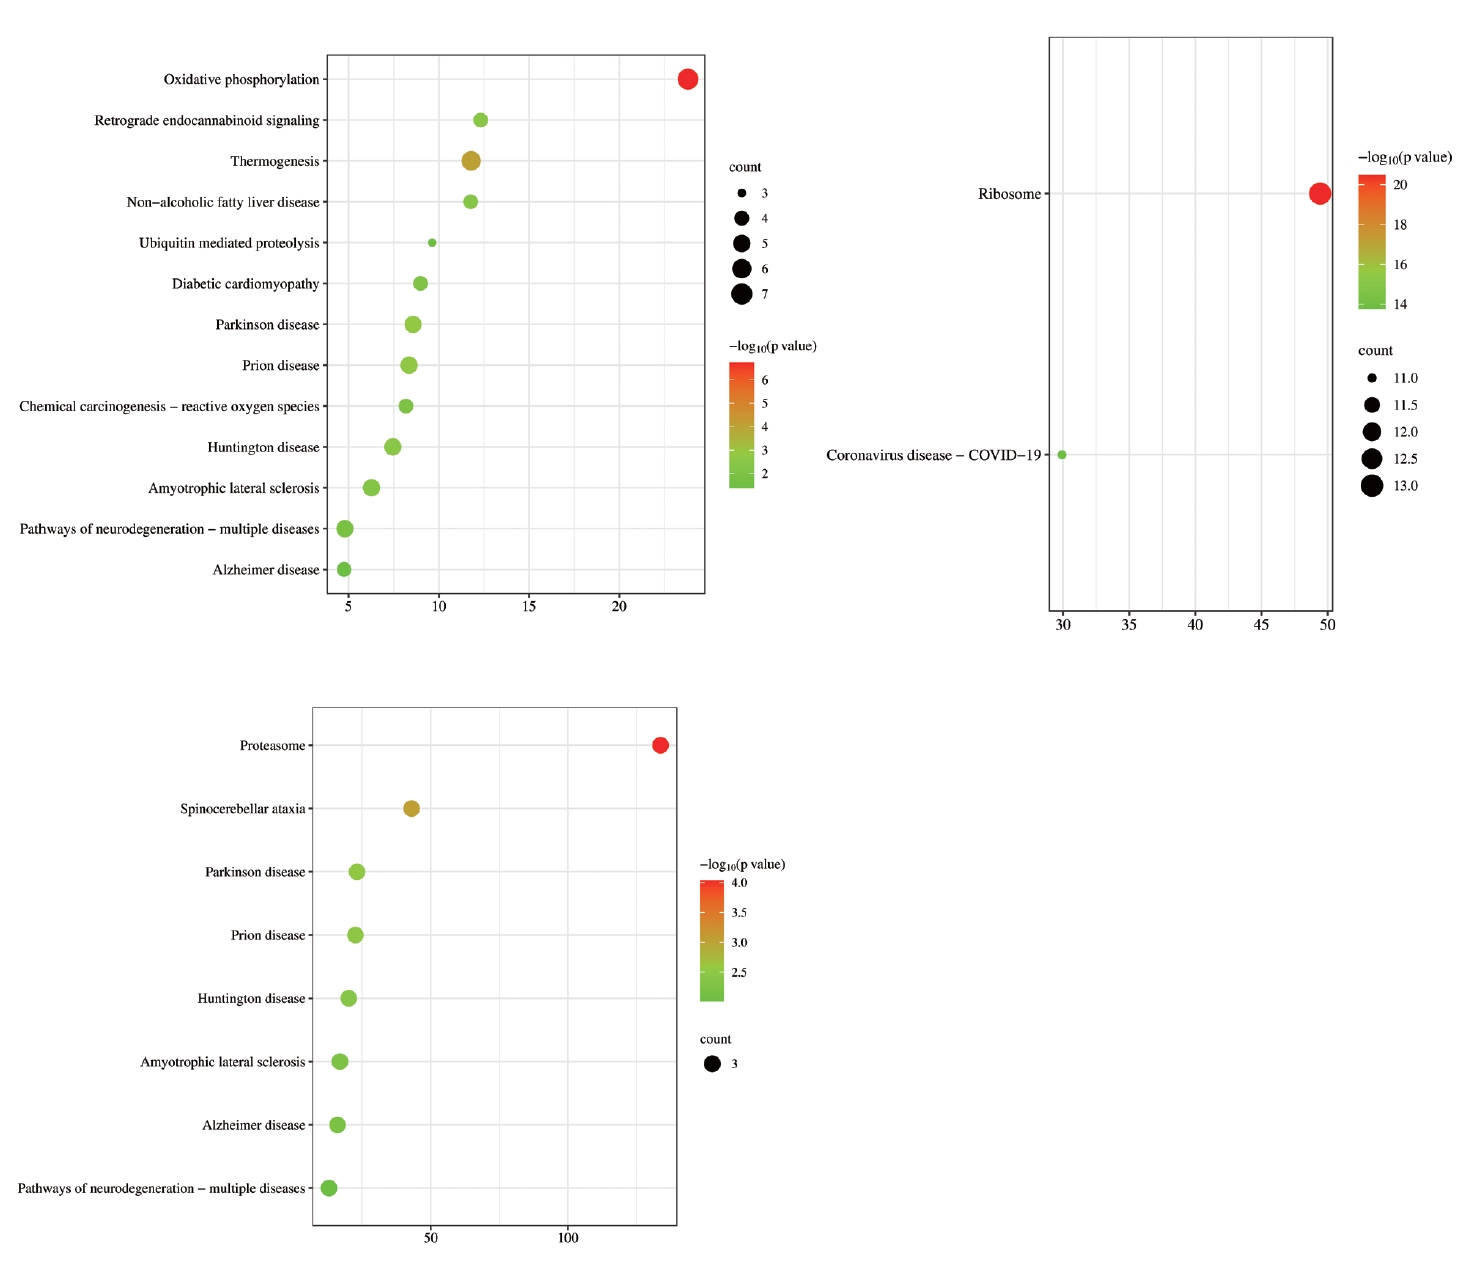
KEGG enrichment analysis of MCODE genes
To determine the distribution of the signaling pathways for the genes in the gene clusters from the PPI analysis, KEGG enrichment analysis was conducted. The analysis of different MCODE genes (Figure 6) showed that the overlapping DEGs were mainly related to neurological diseases, such as HuntingtonŌĆÖs disease, ParkinsonŌĆÖs syndrome, and AlzheimerŌĆÖs disease. The intersecting genes were also associated with oxidative phosphorylation, ubiquitin mediated proteolysis, proteasomes, ribosomes, and other BPs.
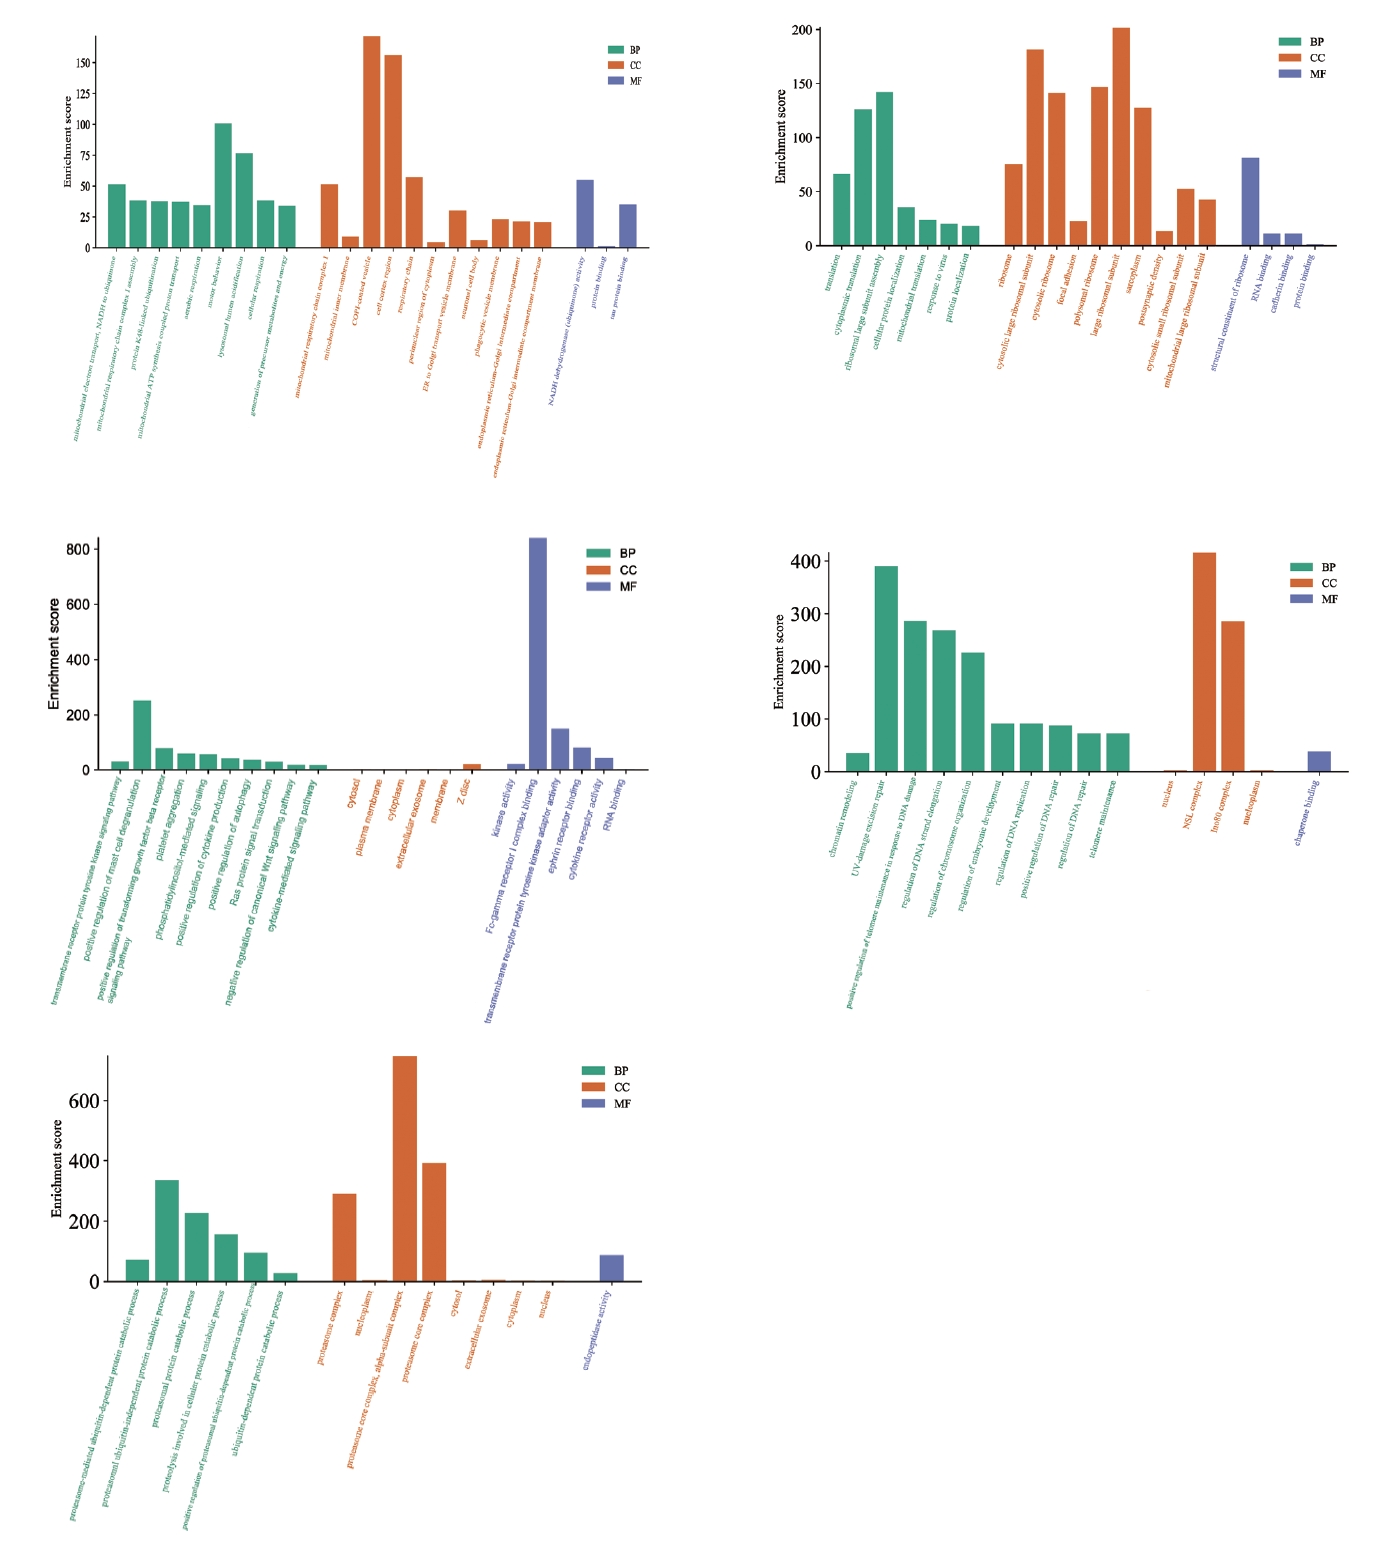
GO analysis of MCODE gene groups
GO analysis from the five groups of MCODE genes (Figure 7) revealed that the main BPs involved were lysosomal acidification, cytoplasmic transfer, ribosomal subunit assembly, mast cell degranulation, and ubiquitin-independent proteasome protein degradation. The CC category included genes related to COPI-coated cell vesicles, cell membrane composition, ribosome subunit composition, and proteasome composition. The DEGs from the MFs category included genes related to tau protein binding, NADH coenzyme activity regulation, ribosome structure formation, Fc-╬│ receptor 1 complex composition, and regulation of endogenous peptidase activity. By summarizing GO enrichment results from different MCODE groups, we concluded that DEGs in patients with OCD were mainly involved in protein synthesis and degradation, and that OCD was related to immunity.
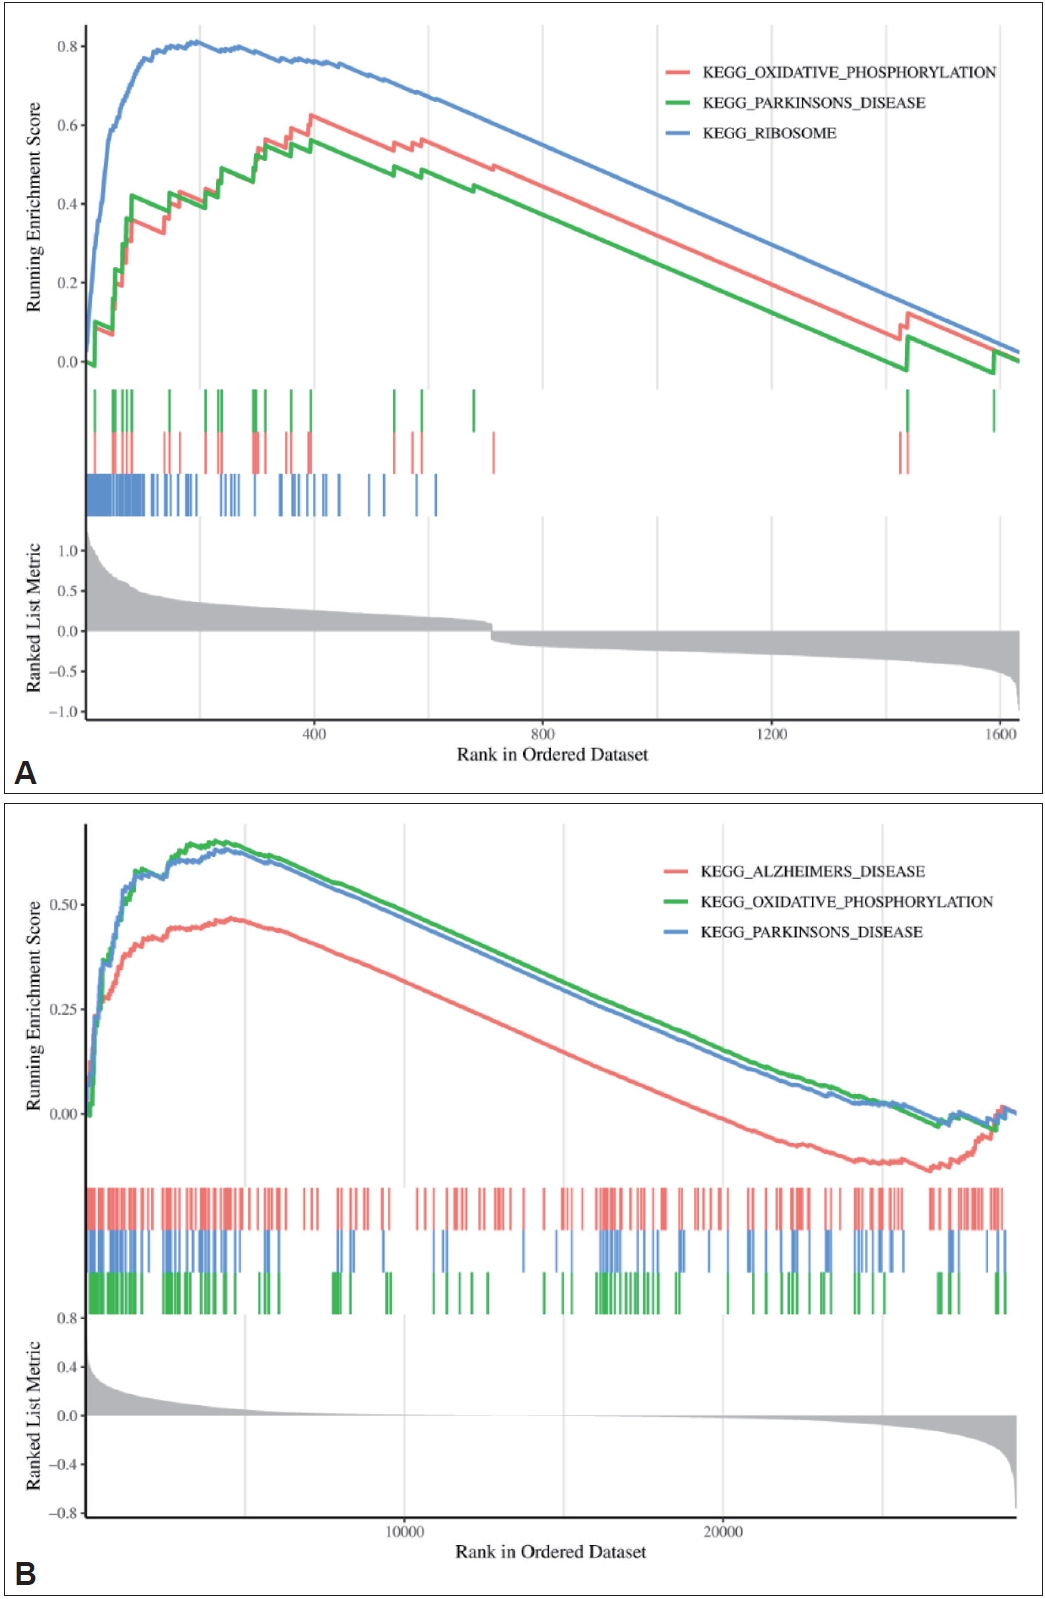
GSEA of GSE78104 and GSE60190 datasets
To explore which signaling pathways were associated with the DEGs in the two datasets, GSEA was performed, and the results are shown in Figure 8. The DEGs in the GSE78104 dataset were mainly related to oxidative phosphorylation, ribosomes, and ParkinsonŌĆÖs disease. The DEGs in the GSE60190 dataset were also related to oxidative phosphorylation and ParkinsonŌĆÖs disease, as well as AlzheimerŌĆÖs disease. These results suggest that the pathogenesis of OCD may be similar to that of neurodegenerative diseases and provide a basis for further study.
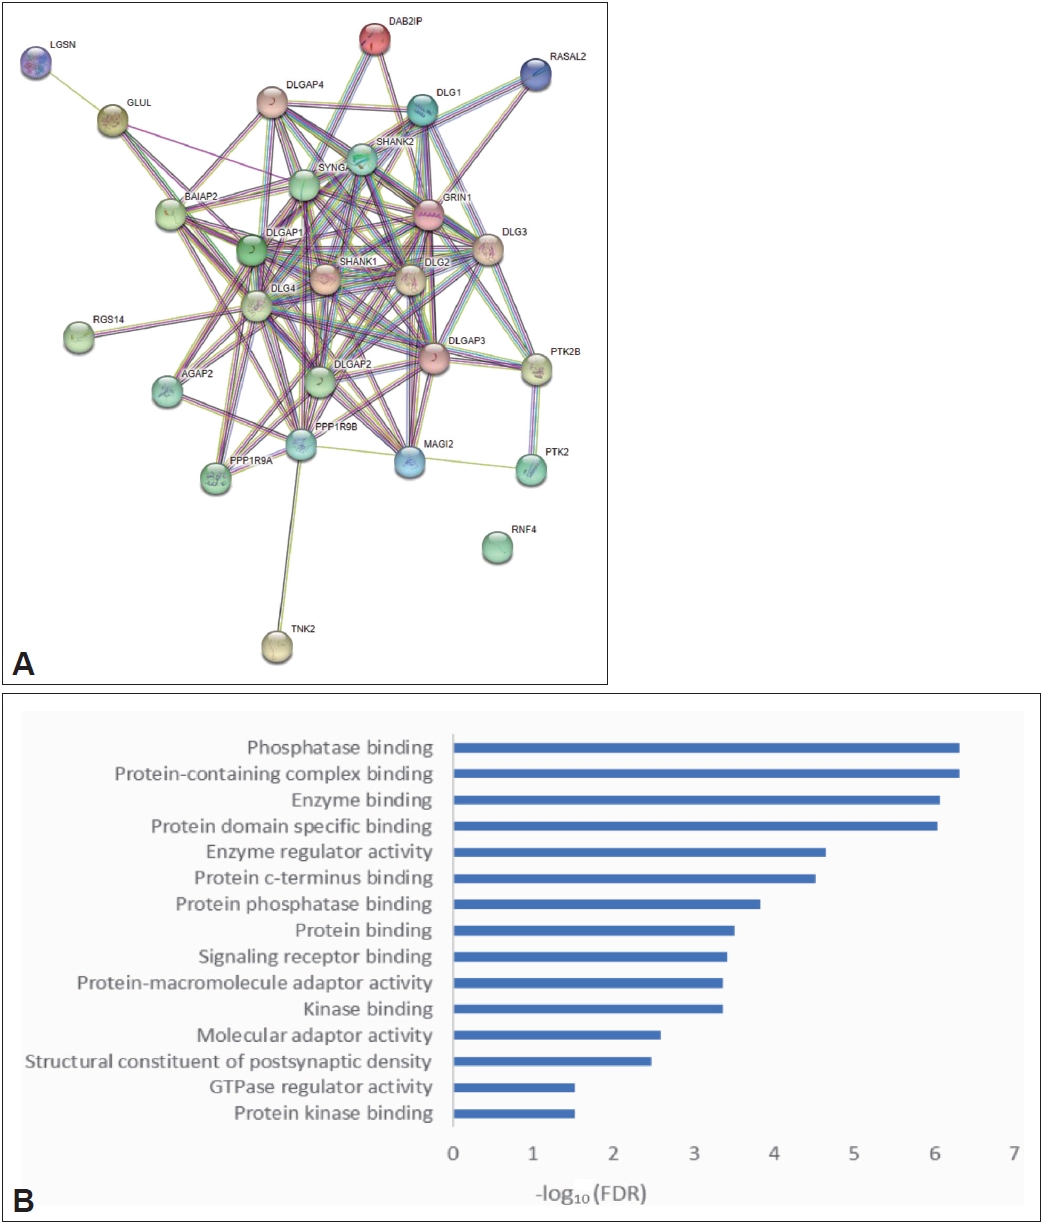
Bioinformatics analysis of the possible causes of OCD caused by SAPAP3 knockout
The SAPAP3 knockout mouse model has been used for studying OCD. However, the mechanism by which SAPAP3 knockout causes compulsive behavior in mice has not been studied in detail. Through PPI analysis of SAPAP3 and GO enrichment analysis of key genes interacting with SAPAP3 (Figure 9), we discovered that genes interacting with SAPAP3 were mainly enriched in the biological function category of phosphatase binding. Previous enrichment of DEGs in OCD also revealed that these genes play a role in the process of oxidative phosphorylation, suggesting that SAPAP3 may affect the metabolic processes of mice with OCD by regulating oxidative phosphorylation.
DISCUSSION
By intersecting two mRNA sequencing datasets of OCD and conducting bioinformatics analysis of genes at the intersection, we discovered that OCD may have a pathogenesis similar to that of other neurological diseases, such as AlzheimerŌĆÖs, ParkinsonŌĆÖs, and HuntingtonŌĆÖs diseases. There are currently few studies on the neural circuit mechanisms of OCD, and the cost of such research is high. Therefore, research on the pathogenesis of existing diseases can be used to guide future research on the neural circuit mechanisms of OCD. At present, research on neurodegenerative diseases such as AlzheimerŌĆÖs disease is relatively mature, with many related mechanism studies [10-13]; therefore, research on the mechanism of OCD has a high reference value.
Furthermore, data integration analysis revealed that DEGs in patients with OCD were primarily concentrated in oxidative phosphorylation, metabolism, and other related signaling pathways and BPs. This suggests that the onset of OCD may be related to abnormalities in these metabolism-related signaling pathways, and that these metabolic indicators will change in patients with OCD, providing a reference value for the diagnosis and treatment of OCD in the future.
Sapap3 is a protein-coding gene for SAPAP3, also known as DLGAP3. SAPSP3 is the only protein in the SAPAP family that plays a role in the striatum, and its deletion results in abnormal nerve signal transduction [14-16]. SAPAP3 is primarily found in synapses and a component of the postsynaptic dense layer. The SAP90/PSD-95 family of proteins are scaffolding protein centers in the postsynaptic dense region, and they contain three PDZ protein domains, one SH3 domain, and one guanylate kinase domain [17]. SAPAP3 is highly expressed in cholinergic and glutaminergic synapses and involved in the complex assembly of proteins and the regulation of postsynaptic neurotransmitter receptor activity, which primarily occurs at the neuromuscular junction [18]. The PDZ region of the SAPAP3 protein can bind to NMDA receptors and other ion channels [19], and has molecular adaptor activity and scaffold protein binding activity [20]. The guanylate kinase region binds to the SAPAP/GKAP/DAP family of proteins [21].
Many studies have confirmed that SAPAP3 is involved in the molecular organization of synapses and neuronal cell signal transduction, possibly by connecting ion channels and the subsynaptic cytoskeleton and inducing PSD-95/SAP90 enrichment in the plasma membrane [22-24]. Trichotillomania and impulse control disorders are associated with SAPAP3 [25]. Related pathways include PPIs at synapses and chemical intersynaptic transmission. GO annotations associated with Sapap3 included amyloid-beta binding. An important byproduct of this gene is DLGAP2.
In addition, SAPAP3 has been linked to fragile X syndrome, which is characterized by mental retardation and behavioral abnormalities [26]. Most children with fragile X syndrome are hyperactive, inattentive, impulsive, manic, and disruptive. Autism is also more common in children with this disease [27,28].
SAPAP3 knockout mice are recognized as an animal model for the study of OCD. When the Sapap3 gene is knocked out in mice, they show hair plucking behavior, similar to the behavior of forced hand washing in humans and reverse learning disorders, which are important behavioral markers of OCD [15,18,29,30]. SAPAP3 knockout mice are important tools for studying the neural circuit mechanisms of OCD [31,32].
Several studies have reported an association between SAPAP3 and OCD. SAPAP3 mutant mouse models show a significant increase in the postsynaptic density of NR1 and NR2B in the mouse striate, and decreased levels of NR2A, suggesting that SAPAP3 plays a role in the maturation of corticostriatal synaptic function. Brain slices of SAPAP3 mutant mice were observed using electron microscopy, and the thickness of the dense layer of the striatum was reduced. Based on the above results, the structure and function of the cortex-striatum in mice changes after SAPAP3 mutation.
Although SAPAP3 mutations cause obsessive symptoms in mice, the underlying mechanisms are not well understood. Some studies have found that SAPAPs, through their influence on mGluR activity, may act as regulatory molecules to control the threshold for inducing endocannabinoid-mediated synaptic plasticity, which may be an indirect mechanism by which SAPAP3 causes OCD [33]. Another study found that SAPAP3 binds to Neural Abelson-related gene-binding protein 2 (nArgBP2), which regulates excitatory synapse formation by controlling dendritic spinous morphology [34]. Thus, SAPAP3 plays a role in manic, autistic, and obsessive behaviors, and the combination of SAPAP3 and nArgBP2 may affect pathogenesis.
The development of the SAPAP3 knockout mouse model for studying OCD was a key step in the study of the neural circuit mechanisms of OCD. However, there have been few studies on the mechanism of compulsive behavior caused by SAPAP3 knockout in mice. We found through our analysis that genes that interact with SAPAP3 were enriched in the biological function category of phosphatase binding, which was consistent with the DEGs in OCD. These results provide evidence as to why SAPAP3 knockout causes compulsive behavior.
This paper provides valuable insights into the pathogenesis of OCD by identifying potential genes and pathways associated with the development of OCD. These findings may help clinicians better understand the molecular mechanisms of OCD and identify new targets for treatment and prevention strategies. In addition, the identification of key genes and pathways may induce the development of personalized or precision medicine approaches for people with OCD, improving their clinical outcomes.
A limitation of this study is that only existing sequencing data were used to identify signaling pathways and BPs associated with SAPAP3 in patients with OCD, and these predictions have not been validated in animal models. In the future, the SAPAP3 knockout mouse model needs to be customized and used to validate the signaling pathways identified in our analysis.