INTRODUCTION
Depression (i.e., major depressive disorder or clinical depression) is the most common psychiatric disorder in the general population and is characterized by persistent feelings of sadness, loss of interest or pleasure, neurovegetative disturbance, and reduced energy [1,2]. In its most severe form, depression can lead to increased risk of suicide. Depression often follows a chronic course, substantially impairing psychosocial functioning [3]. According to the World Health Organization, an estimated 322 million people, or about 4.4% of the global population, were suffering from depression as of 2017 [4]. Despite its very high incidence rate, depression is frequently unrecognized and untreated. In South Korea (hereafter Korea), mental-health problems have become an important national issue. Korea’s public health authority has focused heavily on mental health, particularly depression, due to the country’s consistently high suicide rate relative to other Organization for Economic Cooperation and Development (OECD) member nations [5]. In fact, Korea has had the highest suicide rate among OECD countries in annual rankings more than 10 times since 2003 [6]. Korea’s suicide rate of 29.1 per 100,000 people in 2015 was up to five times higher than the rate in other OECD countries [6]. Suicide has been the leading cause of death for Koreans in their twenties and thirties, according to the National Statistical Office of Korea [7]. Presumably, depression plays a prominent role in many of these suicides. In Korea, the diagnosed prevalence rate for depression was 3% in 2016, with slightly greater prevalence among men (3.1%) than among women (2.9%) in the 18-29 age bracket [8].
Entering university can be a highly stressful life transition for many or even most students, bringing with it increased exposure to stressors. During this crucial stage, students commonly experience financial stress, academic demands, fear of failure or future, and stress in interpersonal relationships [9]. Korean university students are no exception to these patterns. Many of them experience significant stress related to job seeking, military service requirements, and competition for good grades [10]. As a result, depression is common among Korean university students and is associated with increased frequency of suicidal ideations, substance abuse, and acute infectious illnesses [11]. Additionally, the association between depression and increased susceptibility to acute infectious illness is mediated through down-regulation of the immune system, which in turn lowers infectious agents [12]. Previous studies have reported that depression is more prevalent in university students compared to the general population, and this prevalence currently appears to be increasing further [9-11,13]. Given the growing prevalence of depressive symptoms and suicide risk among university students, accurate assessment of the presence and severity of depressive symptoms among this population is imperative. One promising instrument for depression screening in university settings is the Patient Health Questionnaire-9 (PHQ-9) [14], a nine-item measure designed to assess the severity of depressive symptoms based on diagnostic criteria from the Diagnostic and Statistical Manual of Mental Disorders (DSM-IV) [15].
The psychometric properties of the PHQ-9 have been evaluated with various population, including psychiatric patients [16,17], specific groups of medical patients [18-21], the general adult population [22,23], multicultural populations [24-27], the elderly [24], university students [13,25,26], and adolescents [27]. Although the internal consistency of the PHQ-9 has proved to be adequate (α=0.70-0.93) [13,16-27] and the results have indicated moderate to strong associations with related measures of depression and anxiety, analyses of the underlying factor structure of the PHQ-9 have been generally inconsistent. For example, several studies have suggested that a one-factor model reflecting unidimensionality of the depression construct provided the best fit to the data among primary care patients [14], U.S. and Nigerian college samples [13,25], general adults in Hong Kong and Germany [22,23], and adolescents in Ghana [27]. However, other studies in primary care settings with psychiatric patients [16,17], patients with coronary heart disease [18], traumatic spinal cord injury patients [19-21], elderly psychiatric patients in Taiwan [24], and female Latina university students [26] found that two-factor models distinguishing somatic and non-somatic domains best represented the PHQ-9 factor structure. These contradictory findings may be partly due to the use of individuals with different cultural backgrounds (e.g., Hong Kong versus the United States), differences in age ranges (e.g., older adults versus adolescents) and participant characteristics (e.g., individuals with spinal cord injuries as compared with community-based participants), and small sample sizes (one sample size in a study of college students was 16,754, but the other two were only 857 and 512) [13,25,26]. Methodologically, in such situations, confirmatory factor analysis (CFA), a commonly used approach to evaluating the factorial validity of psychometric properties, is more appropriate, as it may provide more definitive conclusions regarding the measurement model of the PHQ-9 than explorative factor analysis, which assumes no a priori hypotheses.
Although the PHQ-9 has been well validated in primary care settings [28,29], its psychometric properties have not previously been tested with Korean university students, for whom the identification of efficient measures of depression is especially important. Given the high prevalence of depression in university students and the need for brief instruments that can accurately evaluate depressive symptoms in this population, the PHQ-9 may be a particularly useful measure. Furthermore, although the PHQ-9 was originally designed for use in primary care settings, its brevity, ease of scoring, and free public availability make it an attractive option for the university context [13]. To assess the appropriateness of the PHQ-9 for use with university students in Korea, we examined its psychometric properties (specifically, factor structure, internal consistency, and convergent validity) with a Korean sample in this study. Our objectives were to examine the factor structure of the PHQ-9 by comparing the fits proposed in previously suggested one-factor and two-factor models, and to explore the construct validity of the tool by administering it in conjunction with other measures that assess similar psychiatric constructs.
METHODS
Sample
Data were collected from 582 undergraduate students (234 male and 348 female) attending a four-year private university in the central region of Korea. The students’ courses of study included architecture, design, education, and social and child welfare. The participants ranged in age from 18 to 30 years (M=20.3, SD=2.00), with the great majority (70%) between the ages of 19 and 23. The mean age was 19.8 for female students (SD=1.51) and 21.0 for male students (SD=2.39). Table 1 summarizes the sociodemographic information of the participants.
Procedure
This study was approved by the Institutional Review Board of Woosong University (Protocol Code: 1041549-190709-SB-76). We made arrangements with academic instructors for students to complete the questionnaires as a group during scheduled class time. Either the principal investigator or the coauthor was present at each administration to provide instructions. The questionnaire was administered in paper-and-pencil form. Written informed consent was obtained from all participants after the aims and objectives of the study had been explained. Participants were informed about the content of the questionnaires and that participation was entirely voluntary. Participants were also assured that the anonymity and confidentiality of their responses would be protected. On average, the questionnaire took about 15 to 20 minutes to complete.
The Patient Health Questionnaire-9
The PHQ-9 [14] is a nine-item self-report measure used to assess the severity of depression. The items are based on the DSM-IV’s diagnostic criteria for major depressive disorder. On each of the nine items, participants are asked to self-rate how often they have experienced the indicated symptoms of depression over the previous two weeks on a 4-point Likert scale: 0=“not at all,” 1=“several days,” 2=“more than half the days,” and 3=“nearly every day.” The scores on each measure are summed, resulting in a total score that can range from 0 to 27, with higher scores reflecting a greater symptom severity (0 to 14=minimal depression, 15 to 19=moderate depression, and more than 20=severe depression). This study used the Korean version of the PHQ-9, which has been validated and used in a small number of studies on Korean psychiatric patients and elderly populations [28,29].
The Depression Anxiety and Stress Scale-21
The Depression Anxiety and Stress Scale-21 (DASS-21) [30] is a self-report instrument consisting of three subscales of seven items each, designed to assess depression, anxiety, and stress, respectively, over the last week. Each item is scored on a 4-point Likert scale ranging from 0 (“did not apply to me at all”) to 3 (“applied to me most of the time”). Scores for the three scales are calculated by aggregating the scores for the relevant items, with higher scores indicating higher levels of symptoms. This study used the Korean version of the DASS-21, which has been demonstrated to exhibit excellent psychometric properties. Cronbach’s alpha for the present sample was 0.90 for depression, 0.84 for anxiety, 0.88 for stress, and 0.95 for the total DASS-21 score.
The Generalized Anxiety Disorder-7
The Generalized Anxiety Disorder-7 (GAD-7) [31] is a self-report questionnaire for screening and measuring the severity of general anxiety disorder on a 4-point Likert scale, from 0 (“not at all”) to 3 (“nearly every day”). It comprises seven items, and the scores are summed to yield a total score that can range from 0 to 21. The Korean version of the GAD-7, which was used in the present study, has demonstrated good reliability and constructs validity in primary care settings. Internal consistency of the GAD-7 in the present study was excellent (α=0.91).
Statistical analysis
The data were analyzed using IBM SPSS Statistics for Windows, Version 23.0 (IBM Corp., Armonk, NY, USA) and AMOS 20.0 (IBM Corp.) [32]. Before we conducted the analysis, the data were screened for missing values. The rate of missing data was minimal (below 5%). The largest number of missing cases was 15, less than 5% of the total number of cases in the dataset. Missing data were replaced using the expectation maximization (EM) algorithm [33]. The EM algorithm is an iterative method of finding the maximum-likelihood estimate of the parameters of an underlying distribution from a given dataset when the data are incomplete or have missing values [33,34].
Next, CFA with the maximum-likelihood procedure was used to test a series of alternative plausible models for the structure of the PHQ-9. CFA is used to test statistically whether a hypothesized linkage pattern between the observed variables and their underlying latent constructs actually exists [35]. CFA was chosen because it not only enables specific hypothesis testing but also determines a priori the structure of the instrument as theoretically designed [35,36]. Hence, items that belong to a factor are allowed to load on that specific factor, whereas items that do not designate a factor are eliminated. This method is also particularly useful in scale development to test a measure’s internal consistency and validity [36]. To examine the goodness-of-fit of each model, the following model fit indices and their criteria were used: chi-square (χ2) and its subsequent degrees of freedom (df); CFI; goodness-of-fit index (GFI); root mean square error of approximation (RMSEA) and its 90% confidence interval (90% CI); and standardized root mean square residual (SRMR). CFA values of 0.95 or higher indicate good fit [37], although some researchers have suggested cutoffs of 0.90 [38]. GFI values greater than 0.90 indicate excellent fit [39]. RMSEA values of 0.05 or less are indicative of good fit, whereas values up to 0.08 can indicate fair or reasonable errors of approximation and values between 0.08 and 0.10 indicate mediocre fit [40]. As with the RMSEA, smaller SRMR values reflect good model fit. SRMR values of 0.05 or less are indicative of a close fit, whereas values of 0.08 are considered acceptable fit [39].
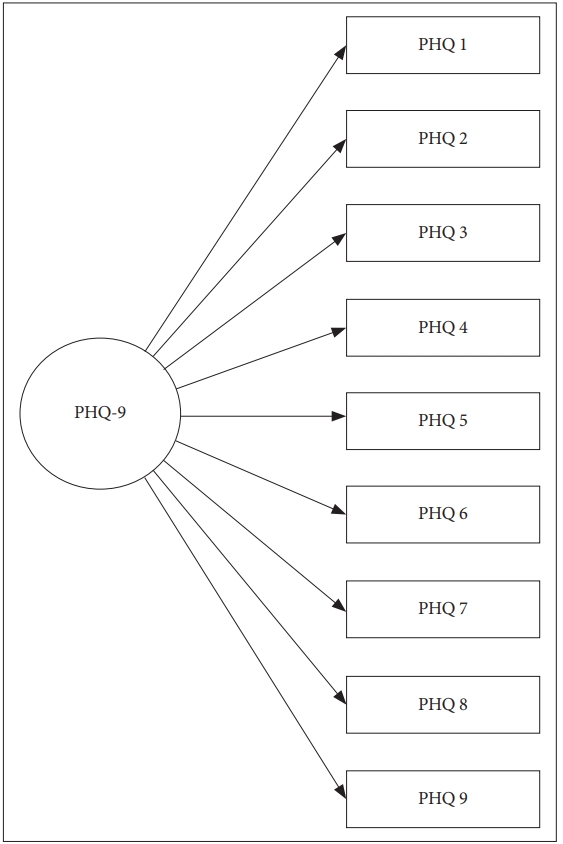
Four competing models suggested by the extant literature were tested and the resulting fit indices were compared to assess how well each model fit the data. Model 1 is the original one-factor model hypothesized by Kroenke et al. [14] with all nine PHQ items loaded onto a single factor. The other three competing models contain slightly different two-factor structures with varying item loadings on the somatic and non-somatic factors. Model 2a is the two-factor model of Krause et al. [19] with the three items “sleeping difficulties,” “fatigue,” and “appetite change” loading on one somatic factor and the other six items loading on a non-somatic factor. Model 2b, derived from Richardson and Richard [21], is similar to Model 2a, except that the items “concentration difficulties” and “psychomotor agitation/retardation” load on the somatic factor. Model 2c is based on the work of Krause et al. [20] This model is similar to Model 2b, except that the item “anhedonia” loads on the somatic factor. A single-group confirmatory factor analysis was also performed to determine goodness-of-fit indices of the four competing models across gender.
After we examined the goodness-of-fit with the PHQ-9 for competing models, we used chi-square difference tests to determine whether the models were significantly different from one another. To assess the convergent validity of the PHQ-9, the associations between the PHQ-9 and the criteria instruments DASS-21 and GAD-7 were examined using correlation with Pearson’s r. Internal consistency was determined by calculation of Cronbach’s alpha.
RESULTS
Descriptive statistics
The participants’ scores ranged from 0 to 27, with a mean of 5.72 (SD=0.28). Hence, the current sample overall tended to exhibit only mild symptoms of depression. With regard to reliability, the internal consistency of the PHQ-9 in this sample indicated an adequate Cronbach’s alpha of 0.83.
Factor structure of the PHQ-9
Table 2 presents the goodness-of-fit indices for the competing models. Across the whole sample, the original one-factor model (Model 1) fit the data well, as indicated by relatively high estimates of CFI and GFI and low estimates of RMSEA and SRMR [χ2=223.9, df=27; CFI=0.91; GFI=0.98; RMSEA= 0.089 (90% CI=0.074-0.085); SRMR=0.051] (Figure 1). The goodness-of-fit indices for all three two-factor models did not meet the required cutoff values. Model 2a provided the worst fit compared to all other models [χ2=1069.8, df=26; CFI=0.53; GFI=0.84; RMSEA=0.263 (90% CI=0.250-0.276); SRMR=0.225]. Model 2b fit the data marginally better than Model 2a, as evidenced by a slight decrease in the chi-square value, CFI, GFI, RMSEA, and SRMR, but the indices did not meet the accepted fit criteria [χ2=1065.3, df=26; CFI=0.57; GFI=0.87; RMSEA=0.232 (90% CI=0.249-0.135); SRMR=0.224]. Finally, Model 2c yielded almost identical fit indices to Model 2a [χ2=1069.1, df=26; CFI=0.53; GFI=0.84; RMSEA=0.263 (90% CI=0.249-0.276); SRMR=0.225]. More importantly, this lack of fit is further underscored by a significant chi-square difference between Model 1 and each of Models 2a [χ2 (1)=845.8, p<0.001), 2b (χ2 (1)=841.4, p<0.001], and 2c [χ2 (1)=845.2, p<0.001].
Thus, the one-factor model (Model 1) was deemed the best fit to the data for the entire sample, which appeared to be unidimensional rather than multidimensional. All standardized factor loadings for the one-factor model were significant at p<0.01 and ranged from 0.53 to 0.79, indicating good factor loading. Table 3 presents the standardized factor loadings of the one-factor model. In addition, the results also showed that a one-factor model best characterizes the structure of the scale across gender. Hence, there was no difference in the factor structures between male and female students.
Convergent validity
The PHQ-9 was moderately and positively correlated with scores on the three subscales of the DASS-21, including depression (r=0.69), anxiety (r=0.60), and stress (r=0.62), as well as with the GAD (r=0.68), which measures anxiety. Convergent validity was, therefore, satisfied for the PHQ-9 with our sample.
DISCUSSION
To the best of our knowledge, this is the first study to examine the psychometric properties of the PHQ-9 among Korean university students. Testing of the original version of the PHQ-9 with a large primary care sample in a previous study revealed that the instrument has strong psychometric properties, as evidenced by its good reliability and good criterion, factorial, and convergent validity [14]. Our analyses also considered the PHQ-9’s factor structure, internal consistency, and convergent validity. Four competing models were tested, and the results from the CFA suggested that an original one-factor model provided the best fit to the data for Korean university students. Furthermore, single-group CFA results also supported the original one-factor structure of the PHQ-9 for both genders. This finding is consistent with results reported in previous studies of U.S. and Nigerian college samples [13,25], general adults in Hong Kong and Germany [22,23], adolescents in Ghana [27], and primary care patients [14]. Most studies examining the factor structure of the PHQ-9 have corroborated the scale’s unidimensional structure. However, other studies have reported a non-somatic (affective) and a somatic dimension [16-21,24,26]. This discrepancy between studies may be due in part to the use of different subgroups of individuals. Our study consisted primarily of individuals with mild depression in a university setting. In contrast, the studies that have indicated a two-factor solution, characterized by somatic and non-somatic (affective) symptoms, were conducted with various clinical populations that present comorbid physical conditions such as spinal cord injury, coronary heart disease, and major depression. Hence, the somatic factor loading may be attributable to possible confounding effects of the physical and mental illnesses [17]. Furthermore, Peterson et al. [17] found that a two-factor model provided the best fit to the data in a sample of primary care patients, whereas our two-factor models fit the data poorly, with the five indices all exceeding conventional cutoff values. However, the subjects in the study conducted by Peterson et al. had a diagnosis of major depression with indication for anti-depressive treatment. As Peterson et al. suggested, one possible explanation for the two-factor solution found in their study was that they had a relatively homogeneous sample, which may have led to a restriction of the range of answers given, thereby attenuating the correlations among the variables. This attenuation can result in falsely low estimates of factor loadings and of correlations among factors [41]. When the PHQ-9 is used with more heterogeneous samples, such as the general population, researchers are more likely to discover a one-factor solution, because the variance is greater and the items are thus more likely to load on one factor [17].
Additionally, Granillo [26] also found that a two-factor solution yielded the best fit to the data among female Latina and non-Latina college students in campus settings. Although these female students might seem to differ in many respects from individuals with severe clinical conditions (e.g., spinal cord injuries or major depression), the fact that somatic and non-somatic symptoms of the PHQ-9 were found to be distinct subscales of depression in both types of populations is likely due to a shared feature of the populations, in that somatic symptoms are considered the norm rather than the exception [26]. Indeed, the students in Granillo’s study scored higher on the somatic subscale than on the non-somatic subscale. Hence, in such a case, the PHQ-9 as a multidimensional measure of depression appeared appropriate for female college students. The internal consistency value of the PHQ-9 was good and in line with prior studies involving both non-clinical and clinical samples in the United States, Germany, Hong Kong, Taiwan, Nigeria, and Ghana. Together, these findings suggest that the PHQ-9 exhibits adequate internal consistency across diverse populations and in different languages. Supporting its use as a measure of severity of depression, the scale’s overall convergent validity was satisfactory, as the scores on the PHQ-9 was moderately and positively correlated with those on other measures of depression and anxiety.
Given that depression among university students is a major concern in university mental-health settings, our results have important implications for the assessment and diagnosis of depressive symptoms among Korean university students. As Keum et al. [12] suggested, in comparison to other commonly used measures of depression, the PHQ-9 provides some practical advantages in the clinical assessment of depression in university settings due to its brevity, ease of scoring, and adequate psychometric properties. These advantages can enable the PHQ-9 to be applied effectively as a screening tool for prevention and monitoring purposes on university campuses. For example, the university might consider including the PHQ-9 in surveys administered to incoming students [13]. Alternatively, university healthcare professionals could offer free on-campus screenings, and students deemed at risk due to depressive symptoms could then be linked to appropriate therapeutic resources. Because of the PHQ-9’s self-report format and its ease of both administration and interpretation, students may be more motivated to complete the PHQ-9 than to give answers to a more time-consuming or intrusive instrument.
Several limitations of this study should be considered. First, the generalizability of the current findings may be limited because our study sample was relatively homogeneous (consisting solely of university students). Therefore, the factorial structure of the PHQ-9 may be different for various populations such as adolescents, older adults, individuals with more severe clinical conditions, and culturally diverse populations. Although the current study supported a one-factor model of the PHQ-9 as a valid measure for Korean university students, this finding does not mean that the multidimensional model of the PHQ-9 is invalid. It is possible that the competing two-factor models may be more appropriate with other populations. Replication with more heterogeneous samples is thus needed to examine the utility of the PHQ-9 across diverse populations [13,26]. Also, the use of self-report measures may be susceptible to response bias and shared method variance. Future research using additional forms of assessment, such as interviews and physiological examinations, would address or clarify this issue. Finally, this study did not assess the test-retest reliability of the PHQ-9. Future research should collect data on the temporal reliability of this measure, because it is important to investigate the extent to which scores remain stable over time.
Within these limitations, our findings indicate that the PHQ-9 is a psychometrically sound and unidimensional depression measure for Korean university students. Our results add to the evidence that the PHQ-9 is an efficient and valid self-report depression measure for subjects in both clinical and non-clinical settings.