Psychiatry Investig Search

CLOSE


Psychiatry Investig > Volume 19(12); 2022 > Article
Yoon, Huh, Lee, Kim, Lee, Yang, Jang, Ahn, Oh, Lee, Kang, and Kim: Alterations in Social Brain Network Topology at Rest in Children With Autism Spectrum Disorder

Abstract

Objective

Underconnectivity in the resting brain is not consistent in autism spectrum disorder (ASD). However, it is known that the functional connectivity of the default mode network is mainly decreased in childhood ASD. This study investigated the brain network topology as the changes in the connection strength and network efficiency in childhood ASD, including the early developmental stages.

Methods

In this study, 31 ASD children aged 2-11 years were compared with 31 age and sex-matched children showing typical development. We explored the functional connectivity based on graph filtration by assessing the single linkage distance and global and nodal efficiencies using resting-state functional magnetic resonance imaging. The relationship between functional connectivity and clinical scores was also analyzed.

Results

Underconnectivities within the posterior default mode network subregions and between the inferior parietal lobule and inferior frontal/superior temporal regions were observed in the ASD group. These areas significantly correlated with the clinical phenotypes. The global, local, and nodal network efficiencies were lower in children with ASD than in those with typical development. In the preschool-age children (2-6 years) with ASD, the anterior-posterior connectivity of the default mode network and cerebellar connectivity were reduced.

Conclusion

The observed topological reorganization, underconnectivity, and disrupted efficiency in the default mode network subregions and social function-related regions could be significant biomarkers of childhood ASD.

INTRODUCTION

Although no clear mechanism related to the abnormal brain development in autism spectrum disorder (ASD) has been identified, the understanding of the neurobiological causes of ASD is gradually increasing, and research on neuroimaging plays an important role [1-3]. Studies are being actively conducted to extract ASD-specific brain circuits [4-6], and functional brain networks using resting-state functional magnetic resonance imaging (rs-fMRI) have been widely used to explore features of ASD [6-8]. Altered functional connectivity in ASD has been highly reported through rs-fMRI studies [8,9], but the findings regarding under- and over-connectivity in the resting brain are inconsistent [8,10-12].
Evidence regarding abnormalities in the functional connectivity in ASD has gradually accumulated, and it has been suggested that changes in the major brain networks such as default mode network (DMN) are important in the pathogenesis of ASD [13,14]. Previous studies have reported that the DMN is one of the most informative brain networks for distinguishing between ASD individuals and healthy controls [15,16]. The DMN is a well-known brain network overlapping with the social brain network, which is activated during social cognition [17]. Several studies reported that dysfunction of the DMN is associated with social deficits in children and adults with ASD [18-21]. However, studies on the strength of functional connectivity in the DMN are inconsistent [21,22]. Moreover, the majority of the previous studies on the functional connectivity in ASD have targeted subjects aged ≥7 years [8,12], and there are insufficient studies on functional connectivity in young children with ASD. Since ASD is an early onset disease and brain development is fundamental for disease onset [23], it is important to explore the brain network connectivity at a younger age.
In general, functional connectivity based on correlation using resting state fMRI was measured as the pair-wise connection between regions (or nodes). The abnormal functional connectivity in children with ASD through the direct comparison of correlation matrices with children showing typical development (TD) was inconsistent across different studies. There are several reasons for this inconsistency, such as sample heterogeneity, different network definitions such as nodes and edges, and different network thresholds. Since there is no gold standard to set a threshold, studies investigating brain networks have applied various thresholds, which may lead to inconsistent results.
In this study, we adopted topological data analysis (TDA) to bypass the threshold problem. TDA investigates the underlying structure of the brain network, which has high-dimensional relations [24]. It is also known as persistent homology, and it reveals the topological invariants, of a high-dimensional network regardless of the scale, i.e., the threshold [25]. We can also quantify the invariants from the topological space. We investigated the topological features of a brain network by measuring connected components. We measured a single linkage distance (SLD) to quantify the changes in the connected components by performing graph filtration [25]. Graph filtration can bypass the arbitrariness of thresholding for network construction. The SLD for identifying the topological features of the brain network was investigated in ASD, attention deficit hyperactivity disorder [25,26], and Parkinson’s disease [27].
This study aimed to identify and compare the abnormal functional connectivity using rs-fMRI between children with ASD and those with TD including younger age group than previous studies. We used the graph filtration approach to investigate the topological features of the brain network and a graph-theoretical approach to explore the local and nodal efficiencies of the whole brain network. We hypothesized the following: 1) children with ASD show atypical functional connectivity across the whole brain network and within the DMN regions as compared to the age and sex-matched TD children and 2) atypical functional connectivity and clinical features are significantly correlated.

METHODS

Participants

This study included 31 children with ASD and 31 age- and sex-matched children with TD. All the ASD children were initially screened by board-certified psychiatrists for children and adolescents based on the diagnostic criteria of the Diagnostic and Statistical Manual, 5th edition. They were diagnosed according to the Autism Diagnostic Observation Schedule (ADOS) [28] and Korean Childhood Autism Rating Scale (K-CARS) [29,30] at the Child and Adolescent Psychiatry Clinic in Seoul National University Hospital. The exclusion criteria for the ASD group were hereditary genetic disorder, current or past history of brain trauma, organic brain disorder, seizure, or any neurological disorder, schizophrenia or any other childhood-onset psychotic disorder, major depressive disorder or bipolar disorder, Tourette’s syndrome or a chronic motor/vocal tic disorder, and obsessive-compulsive disorder. The TD group included typically developing children without any psychiatric diagnoses. The exclusion criteria of the ASD group were also applied to the TD group with the additional exclusion criterion of ASD diagnosis.
Written informed consent was obtained from all parents or guardians, and the children provided verbal assent to participate after sufficient explanation of the study prior to enrollment. All study protocols were approved by the Institutional Review Board of Seoul National University Hospital (No. 2008-116-1150).

Clinical measures

To examine intelligence, we used the Korean Educational Development Institute-Wechsler Intelligence Scale for Children-Revised [31] for school-age children with language comprehension and the Korean-Leiter International Performance Scale-Revised [32,33] for preschool- and school-age children without language comprehension. Three of the ASD children were tested for intelligence with the Korean Wechsler Intelligence Scale for Children Fourth Edition (K-WISC-IV) [34]. Social ability and social competence were assessed using the Korean translated version of the Social Responsiveness Scale (SRS) [35]. To identify autistic properties, the K-CARS-2 was used for both the ASD and TD groups.

Image acquisition and processing

Image acquisition and preprocessing

All participants underwent T1-weighted structural imaging and rs-fMRI. Scanning was performed using Siemens Trio 3 T MRI scanner (Siemens Medical Systems, Erlangen, Germany) at the Seoul National University Hospital. We analyzed the rs-fMRI data, as the purpose of this study was to explore the differences in the brain functional connectivity between the ASD and TD children.
Some of the participants needed to be sedated with oral chloral hydrate to ensure immobility during MRI. Oral chloral hydrate was administered for sedation in 29 ASD children and 15 TD children in this study, and majority of the children with TD who underwent sedation were 2-6 years old. Therefore, we additionally analyzed the functional connectivity under sedation between 15 ASD and 15 TD children of the preschool age group.
Image parameters and detailed preprocessing are described in Supplementary Material 1 (in the online-only Data Supplement) [36-41].

Graph filtration

To investigate the topological features of the brain network with varying thresholds, we applied graph filtration to find the connected components of the brain graph with filtration. The shape of the network is represented as a single linkage hierarchical clustering and transformed into an algebraic form, a single linkage matrix (SLM) [25]. The SLM was generated by calculating the SLD of cij [25]. cij is the correlation coefficient between nodes i and j, and only positive correlation was analyzed in this study. The distance between two nodes was calculated to estimate SLD as follows: Distance=1-cij. The distance for the threshold gradually increased and was iteratively applied to the distance matrix. The SLM enables the comparison of the patterns of the connecting components between the two groups. Nodes with a shorter distance than the threshold were identified as connected components, and shorter distance between nodes reflects closer coupling between nodes.

Network efficiencies

To investigate the efficiency of the brain network, we calculated global (Eglobal), local (Elocal) and nodal efficiencies (Enodal) using Brain Connectivity Toolbox (https://sites.google.com/site/bctnet/) [42]. A graph G (N, K) comprising N nodes and K edges and a binary matrix, Aij, can be represented by a 273× 273 matrix, where Aij=1, if there is an edge with positive value between node i and j0, otherwise. Degree of i, Ki, is the number of connections linking the node i: ki=jGAij. Global efficiency (Eglobal) of graph G is defined as: EglobalG=1NN1ijG1Lij where, Lij is the shortest path length between nodes i and j in the weighted network W, and it is defined as the smallest sum of the edge distance equivalent to weight inversion throughout all possible paths between nodes i and j. Global efficiency measures the efficiency of parallel information propagation over the network. The local efficiency (Elocal) of a node is calculated as: Elocali=1NiGEglobalGi. Where Gi, is the subgraph of G and consists of the neighbors of node i, and Eglobal>(Gi) denotes the global efficiency of the subgraph Gi. It measures the fault tolerance of a network, indicating communication capability among the neighbors of node i when it is eliminated. Nodal efficiency (Enodal) measures the efficiency of parallel information transfer across the whole network in a node using the following equation [43]: Enodali=1N-1iiG1Lij.

Statistical analysis

In this study, the following four measures were statistically tested: SLDij, Eglobal, Elocal(i), and Enodal(i). The linear regression model evaluated differences in SLD and network measures between the two groups. We included age and sex in the model to regress out the effects as follows: y=β0+β1×Age+β2×Sex+β3×Group+e where, represents the four measures, SLDij, Eglobal, Elocal(i), and Enodal(i), and the fitting was implemented using the leastsquares method. β denotes estimated coefficients of the variables (age, sex, and group), and e refers to an error term. We investigated significant group effects (SLD: p<0.00005, uncorrected; network measure: p<0.05, false discovery rate [FDR] corrected) to find differences between the groups.
To evaluate correlations between measures and age within a group, we performed Pearson’s correlation after partialling out of the sex effect using linear regression. Next, we investigated the association between measures and clinical scores in each of the two groups by Spearman’s correlation after regressing out age and sex effects using a linear regression model. We tested the correlation between edges that showed significant group differences and 11 clinical scores: CARS, ADOS communications, ADOS social interaction, ADOS total, SRS social awareness, SRS social cognition, SRS communication, SRS social motivation, SRS restricted interests and repetitive behavior, SRS social communications index, and SRS total. We analyzed edges/nodes that showed a significant correlation with clinical scores (p<0.05). We analyzed the group differences in the SLD in preschool-age children (age, 2-6 years; ASD group, n=15 and TD group, n=15) to determine whether the underconnectivity was due to the sedation effect. All the preschool-age children in both the groups were sedated.

RESULTS

Participant characteristics

The demographic and clinical characteristics of the ASD and TD group are presented in Table 1. The mean age of the ASD and TD group was between 5 and 6 years old (5.61± 2.53, 5.65±2.48, respectively) and the proportion of male subjects was higher than that of female subjects (19 males and 12 females in each group). The CARS and the SRS were significantly higher in the ASD group because they measure the symptom severity of ASD. The Full Scale IQ was significantly lower in the ASD group.

Group differences in network topology based on graph filtration

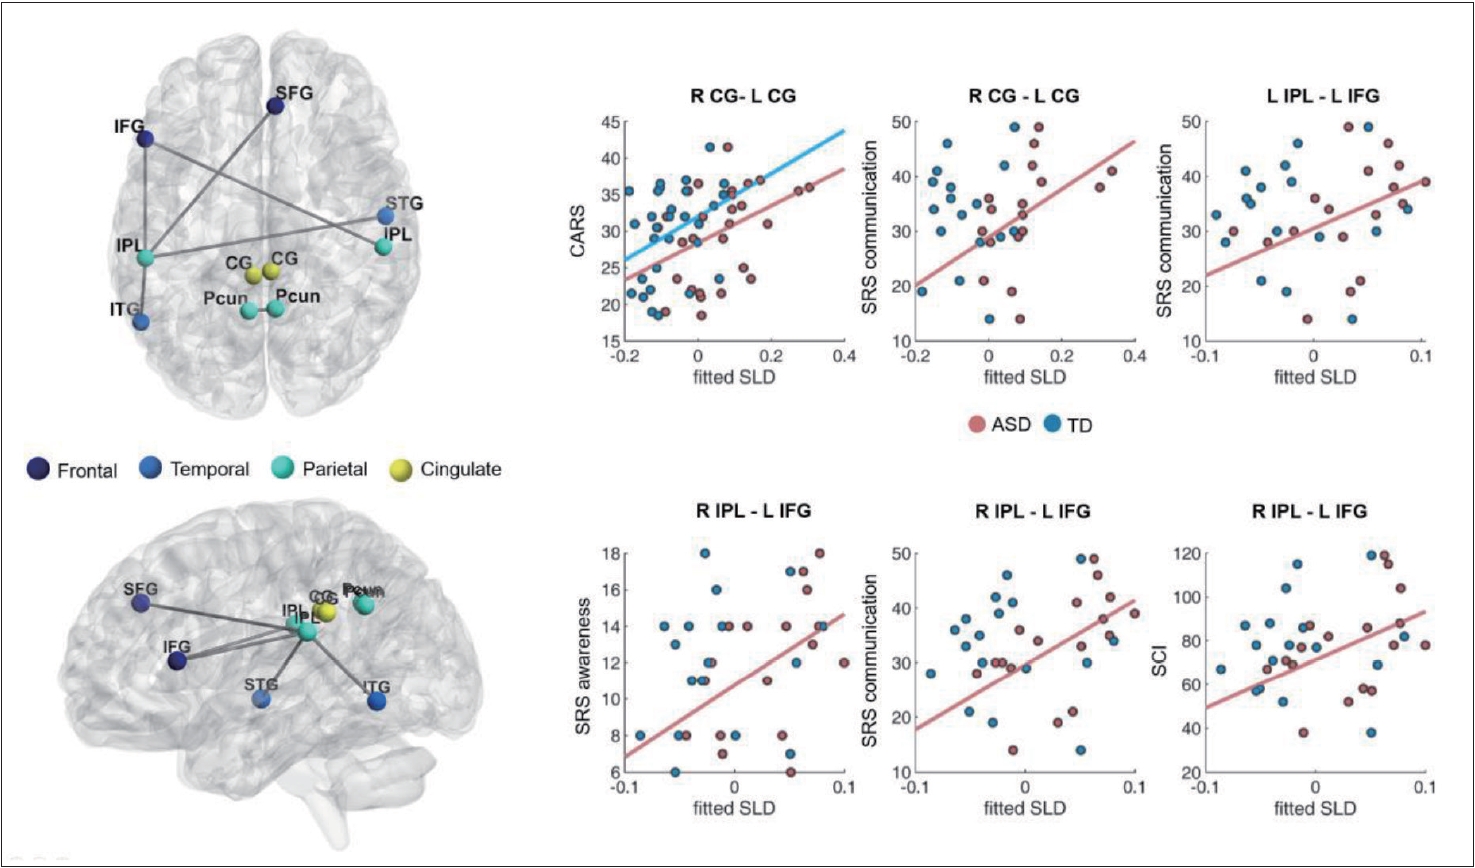
The full Region of interest (ROI) can be found in Supplementary Table 1 (in the online-only Data Supplement). To find significant group differences in network topology based on graph filtration, we compared the SLDs between the two groups. Increased SLDs were found in the ASD group (p< 0.01, FDR corrected). A longer SLD denotes weaker functional connectivity. In ASD, the bilateral connectivities of the dorsal part of the cingulate gyri (area 23) and precuneus (area 31) were significantly decreased, which are sub-regions of the DMN. The bilateral connectivity between the dorsal part of the cingulate gyri significantly correlated with the behavioral score, i.e., the CARS (rho=0.45, p<0.05; n=29) and SRS communication (rho=0.68, FWER p<0.05; n=17) scores, in the ASD group (Figure 1 and Table 2). As compared to the TD group, the ASD group showed decreased functional connectivity of the right inferior parietal lobule (IPL) (rostroventral area 40) with the left inferior frontal gyrus (IFG) (caudal area 45) (rho=0.68, FWER p<0.05; n=17). Moreover, the functional connectivity in the ASD group significantly correlated with the sub-scores of the SRS for communication (rho=0.68, p<0.005; n=17), awareness (rho=0.52, p<0.05; n=17), and social communication index (rho=0.54, p<0.05; n=17). The left IPL was significantly connected with the right superior frontal gyrus (SFG) (medial area 9), left IFG (caudal area 45), right superior temporal gyrus (STG) (rostral area 22), and left inferior temporal gyrus (ITG) (ventrolateral area 37) (Figure 1 and Table 2). The functional distance between the left IPL (rostroventral area 40) and left IFG positively correlated with the SRS communication score (rho=0.54, p<0.05; n=17) in the ASD group.

Group differences in network efficiency

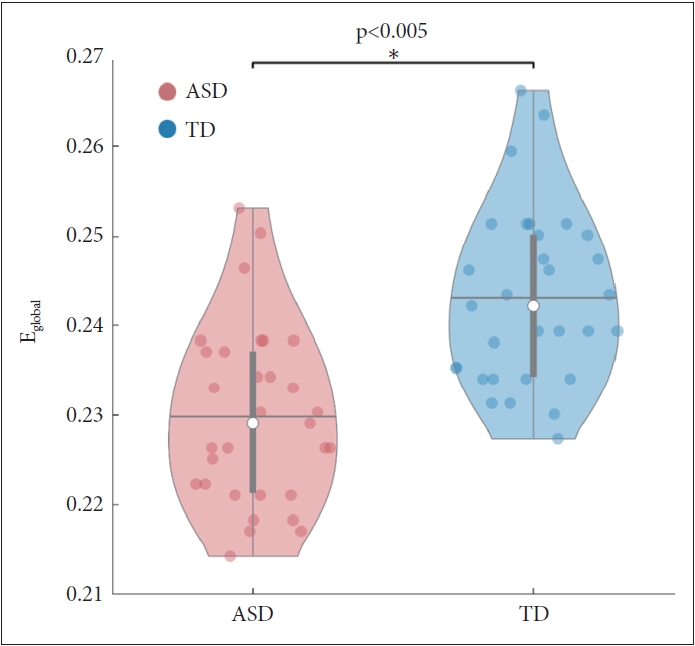
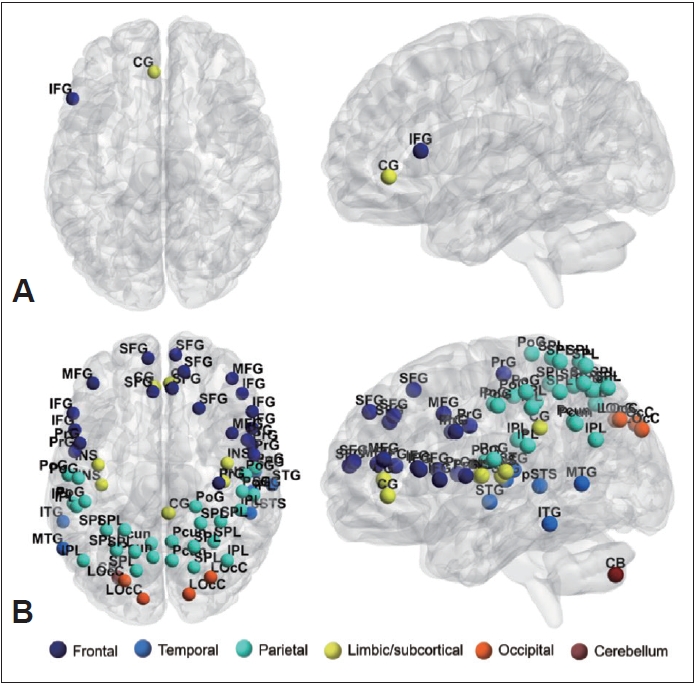
To identify the general network characteristics using graph theoretical measures, we examined the network efficiencies, comprising global efficiency, local efficiency, and nodal efficiency. Global efficiency significantly decreased (p<0.005) in the ASD group (Figure 2). The local efficiency of the left IFG and subgenual area 32 of the cingulate gyrus was lower in the ASD group than in the TD group (p<0.05, FDR corrected) (Table 3 and Figure 3). The local efficiency of the cingulate gyrus negatively correlated with the ADOS total (rho=-0.45, p<0.05) and ADOS social interaction (rho=-0.53, p<0.005) scores (Table 4). The ASD group showed decreased nodal efficiency in the frontal, parietal, insula, and occipital areas as compared to the TD group (p<0.05, FDR corrected) (Table 3 and Figure 3). The nodal efficiencies of the parietal and occipital areas negatively correlated with the CARS scores in the ASD group. The nodal efficiencies of the frontal and parietal areas negatively correlated and the cerebellar crus positively correlated with the ADOS sub-scores. The nodal efficiencies of the occipital and temporal areas negatively correlated with the SRS sub-scores in the ASD group (Table 4).

Functional connectivity and sedation

To determine whether this underconnectivity observed in our results in the ASD group was due to the sedation effect, we analyzed the group differences in the functional connectivity of the preschool children of both groups subjected to sedation during imaging. In these children (age, 2-6 years) subjected to sedation, over-connectivity was not observed. The functional connectivity between the medial (area 9) and lateral (area 10) parts of the SFG were lower in the ASD group than in the TD group (p<0.05, FDR corrected) (Supplementary Figure 1 and Supplementary Table 2 in the online-only Data Supplement). The connectivity between the right SFG (medial area 9) and right superior parietal lobule (SPL; rostral area 7) also decreased. The right SFG (medial area 10) showed decreased functional connectivity with the left SFG (lateral area 9), right STG (area 41/42 and rostral area 22), right SPL (rostral area 7), right IPL (rostrodorsal area 39), and left IPL (rostroventral area 39) (p<0.00005, uncorrected). Additionally, decreased functional connectivity between the cerebellar vermis (lobule X) and left inferior frontal sulcus was also observed. We examined the shape of the distribution of the correlation coefficients between groups with and without sedation (Supplemantary Figure 2 in the online-only Data Supplement). The kurtosis of the correlation distribution for the whole brain graph was compared between the groups with and without sedation. The peakness of the correlation distribution was higher in the sedation group than in the group without sedation (p<0.05), indicating that there were more edges with connectivity values closer to zero in the sedation group.

DISCUSSION

Decreased functional connectivity and impaired social functioning in children with autism spectrum disorder

When comparing the functional connectivity between the groups using network topology based on graph filtration, the ASD group showed decreased connectivity as compared to the TD group in the areas included in the DMN, such as the cingulate gyrus and precuneus (Table 2, Figure 1). DMN dysfunction in ASD has been consistently reported in previous studies [44-46]. In a meta-analysis published in 2019, the authors compared eight different studies that analyzed fMRI scans of target groups with various characteristics using several analytical methods of functional connectivity [11]. The results of this study showed that as compared to the TD children, the resting state functional connectivity of the DMN regions in the ASD children, such as the dorsal posterior cingulate cortex (PCC) and right medial paracentral lobule, was reduced. None of the studies included in that meta-analysis showed an increased local connectivity in ASD children as compared to TD children. In a study involving younger individuals, Yerys et al. [18] compared the resting-state functional connectivity between 22 ASD children aged 8-13 and 22 TD children matched for age, sex, and intelligence quotient. In the ASD children, the functional connectivity of the DMN core regions was reduced in the medial prefrontal cortex and PCC as compared to the TD group. In network segregation analysis, the ASD group showed a pattern of poor segregation of DMN regions as compared to the TD group. Moreover, a significant negative correlation was observed; as the functional connectivity of the DMN decreased, the clinical ASD symptoms worsened.
Similarly, this study found that as the bilateral connectivity between the cingulate gyri decreased in the ASD group, the CARS score, a clinical autism symptom score, increased (Table 2). Considering that the DMN is strongly associated with social cognition [21,47], the association between decreased connectivity of the DMN region and worsening of clinical autism symptoms in the ASD group is reasonable. In addition to the midline structures, we found decreased functional connectivity between the IPL and the frontal and temporal regions (Table 2, Figure 1). The IPL is embedded in several brain networks and converges particularly in the default mode and frontoparietal control networks [48-50]. According to previous studies, as a key node of the action observation network, IPL is known to support imitation behavior and may cause difficulties in the social communication function of ASD if impaired [51,52]. Wymbs et al. [53] reported that a decrease in the functional connectivity of the right IPL in children with ASD was associated with impairment of praxis performance and social skills when comparing the fMRI between children aged 8-12 years with ASD and with TD. Although the regions of the brain in our study did not exactly match those reported in previous studies, we found that the ASD group showed decreased connectivity as compared to the TD group in several areas linked to the IPL. We also found decreased connectivity between the left IFG and bilateral IPL in the ASD group (Table 2, Figure 1). Another study on imitation in ASD reported that IFG activity was weaker and more delayed in the Asperger syndrome group than in the TD group [54]. Furthermore, in a study of the IPL, IFG, and superior temporal sulcus (STS), i.e., brain regions commonly reported to be associated with imitation [54-56], it was found that the effective connectivity between IPL and IFG was reduced in ASD individuals. The authors suggested that the aberrant organization of imitationrelated networks may be associated with impaired development of social communication in ASD [57]. In our study, we observed decreased connectivity in the brain regions of IPL, IFG, and STG, which is consistent with the findings of previous studies. Particularly, since the decrease in connectivity between the left IFG and right IPL showed significant correlation with the communication domain of the SRS sub-scores (Table 2), the association between the corresponding brain area and social communication function can be established.

Aberrant network distribution observed in autism spectrum disorder children using graph theoretical measure

Exploring the difference in the network efficiency between the two groups by applying the graph theoretical method showed that the ASD group had significantly decreased global efficiency as compared to the TD group. Moreover, the local efficiency and nodal efficiency of the ASD group showed decreased network efficiency as compared to the TD group in areas similar to those in the SLD results shown in Table 3 and Figure 3. As the local efficiency of the left cingulate gyrus decreased, the ADOS total and ADOS social interaction scores increased (Table 4). This corroborates with the results identified in the SLD analysis; hence, the importance of the cingulate gyrus in social cognition of ASD is reinforced. The ASD children showed lower nodal efficiencies in several nodes of the frontal, temporal, and parietal areas, bilateral insula, and visual areas as compared to the TD children. On the other hand, the TD group did not show nodal efficiency lower than that of the ASD group. By applying the graph theory, it is possible to identify whether the functional networks of the brain show atypical network distribution, rather than simply distinguishing whether the functional connectivity of ASD individuals is over-or underconnected [58]. In a previous study, when the graph theoretical analysis was applied to the rs-fMRI of the ASD group and the healthy control group, analysis of global metrics showed significantly lowered clustering coefficient and characteristic path length in the ASD group, indicating that randomized organization was observed in the ASD group when compared with the control group [59]. In the same study, significantly altered local metrics were also observed (e.g., the bilateral STS, right dorsolateral prefrontal cortex, and precuneus), and the authors suggested that altered patterns of global and local metrics in ASD may underlie the social and non-social cognitive impairment [59]. We found that compared to the control group, the ASD group showed reduced nodal efficiency in brain areas related to social cognition, such as the precuneus, IPL, IFG, STG, and insula [60-62], as well as decreased nodal efficiency in the areas related to nonsocial cognitive ability in several frontal, temporal, and parietal regions of the brain [5,63-65]. Many of the results of nodal efficiency showed a significant correlation with the clinical scores of ADOS, CARS, and SRS, suggesting that the impairment of social/non-social cognitive ability affects the manifestation of the ASD symptoms, as seen in previous studies.

Decreased functional connectivity observed in preschool-age autism spectrum disorder children under sedation

Approximately half of the TD group and most of the ASD group children were subjected to sedation with chloral hydrate before imaging. Because we were concerned about medication-induced changes in the functional connectivity, we conducted an additional analysis. Moreover, when children subjected to sedation from the ASD and TD groups were analyzed separately, only preschool children aged 2-6 years were included. Thus, we not only excluded the sedation effect, but also explored the difference in the functional connectivity according to age. When comparing the preschool children under sedation between the two groups, it was observed that the functional connectivity of the DMN area remained significantly reduced in the ASD group (Supplementary Figure 1 and Supplementary Table 2 in the online-only Data Supplement). Particularly, the anterior-posterior DMN connection, such as SFG-IPL and SFG-SPL, was noticeably decreased in children with ASD. The most consistently found aberrant functional connectivity in the ASD group as compared to the TD group is the decreased frontal-posterior functional connectivity pattern. Several previous studies have shown decreased synchronization between the anterior and posterior regions [66]. In a study of anatomical and functional connectivity impairment in ASD, Just et al. [67,68] suggested that the behavioral characteristics of ASD are caused by limited communication between the frontal and posterior brain regions. They also predicted that this limitation would affect tasks that require coordination between the frontal and posterior brain regions, such as language comprehension and social interaction processes, and showed that the frontal-posterior coordination was related to these processes based on an fMRI study. Therefore, the authors hypothesized anterior and posterior underconnectivity as the underlying biological mechanism of the impaired function in ASD. Studies on the importance of anterior-posterior coordination in ASD have been conducted previously. Horwitz et al. [69] reported that the metabolic activities between several brain regions in male individuals with ASD were lower than the normal degree as observed with positron emission tomography. Particularly, they observed that the correlation between the frontal and parietal regions appeared to be reduced. In our study, the decrease in functional connectivity between the frontal and parietal regions observed in the preschool age group included the SFG, a region considered to contribute to higher cognitive function [70], and the SPL and IPL, areas known to be associated with visual motor function [71,72]. Furthermore, it has been suggested that the SPL may play an important role in motor learning and repetitive behavior in ASD [73], and the importance of the IPL area is emphasized not only in the control of various movements, but also in the impairment of the social communication function of ASD as mentioned previously [53]. Unfortunately, the correlation between the decline in the frontoparietal functional connectivity and the clinical scores in preschool-age children cannot be considered appropriate in this study due to the small sample size. As compared to the TD group, a decrease in the functional connectivity of the right SFG and right STG was also observed in the preschool-age children with ASD. The right STG is known for its important role in social cognition, which is a characteristically impaired function in ASD, and includes theory of mind, biological motion perception, and voice perception [74-76]. According to a previous study, the right STG is involved in the detailed perceptual processing of social cognition, which is associated with stronger systematization rather than empathizing, a cognitive characteristic of ASD [77].
Additionally, the functional connectivity between the cerebellar vermis and left IFG decreased in the preschool-age children of the ASD group as compared to the TD group. The cerebellum is one of the brain regions where abnormal findings are most consistently found in ASD [78], and it is extensively connected to the cerebrum; thus, cerebellar dysfunction may be implicated in several symptoms of ASD [79]. Particularly, neuropathologic observations of the vermis have been identified from the earliest days of cerebellar imaging studies of ASD [80], and vermal abnormalities are known to be associated with the emotional and behavioral deficits seen in ASD symptoms [81] Previous fMRI studies have reported abnormalities in the vermal activity of individuals with ASD [82]. For example, in a previous study, the ASD group showed a decrease in vermal medial lobule activity upon processing of irony [83], while in another study, abnormal recruitment of the posterior cerebellar vermis was observed when ASD participants processed the facial expression [84]. The underconnectivity between the cerebellar vermis and frontal region observed in this study is consistent with the findings of previous studies on ASD, suggesting that cerebro-cerebellar connectivity can be a biomarker of ASD. It is known that the integrity of the cerebro-cerebellar circuit in the early development stage is more important for cerebral development than in later development stage [85]. Furthermore, the fact that cerebellar damage in childhood can lead to poorer outcomes as compared to that in adulthood [85,86] highlights the significance of the abnormalities of cerebellar functional connectivity found in younger children with ASD. Recent studies have shown that the integrity of the cerebro-cerebellar connectivity is very crucial for early cortical development. As seen in our study, abnormalities in the cerebro-cerebellar functional connectivity found in ASD may impair the development of the cortical areas associated with motor control and language and social interaction, resulting in damage to these domains in ASD individuals [82].

Limitations

This study has several limitations. First, the sedation effect may affect the results. It is not clear how sedation-induced brain network disruptions might affect fMRI activation patterns [87], and it is possible that sedative agents may affect the fMRI results [88]. Therefore, the interpretation of the main results of this study is limited. Although we could exclude the sedation effect from the additional analysis of the preschool age group, it was insufficient because the number of participants was reduced by half. Our findings should be replicated in future studies under conditions that can control the sedation effect. Second, the sample size was relatively small. Moreover, the number of participants reduced further when only preschool-age children were considered. Future research should be conducted with a higher number of participants of the preschool-age group, as well as examination and comparison of the characteristics of functional connectivity patterns between younger and older age groups with ASD. Third, a few ASD children who took medication were included in the analysis. The drugs were anti-psychotics such as risperidone, aripiprazole and quetiapine, and a non-stimulant, atomoxetine. Although only four of the subjects took the medication, the effect of the drug on the results should have been considered. Finally, there are limitations to the results of some clinical measures of this study. The reason is not clear, but a significant number of the SRS scores were missed in the process of acquiring data from guardians. The SRS scores were measured only in 17 in the ASD group and 21 in the TD group. Therefore, there may be limitations in interpreting the correlation between the imaging results and the SRS scores. Regarding intelligence scales, the results could be inconsistent because three different scales were used depending on the age and timing of the measurement. In addition, since the ASD group in this study included relatively low functional level group, the disease itself could have an effect on low intelligence. Therefore, the results of the intelligence tests were not included in the analysis of this study.
This study included participants aged 2-11 years, who were relatively younger than those in previous studies. This study demonstrated the topological network differences using resting state fMRI between the ASD and TD groups, including the main brain networks such as the DMN and social function-related connectivity. We also obtained significant results by exploring the differences in the brain network efficiency using the graph theoretical method. These results showed significant correlations with the clinical scores of the ADOS, CARS, and SRS; thus, the abnormalities in the brain imaging results observed in ASD seem relevant. We conducted additional analyses of the ASD and TD participants of preschool age to exclude the sedation effect from the imaging results. Interestingly, decreased long-range connectivity of more brain regions and decreased cerebro-cerebellar connectivity were observed in the younger participants of the ASD group. These results confirmed that the brain functional connectivity was more impaired in the ASD children than in the TD children. Notably, our findings show that underconnectivity and disrupted efficiency in brain regions primarily related to social function, including the DMN subregions, could be significant biomarkers of childhood ASD.

Supplementary Materials

The online-only Data Supplement is available with this article at https://doi.org/10.30773/pi.2022.0174.
SUPPLEMENTARY MATERIAL 1
pi-2022-0174-suppl1.pdf
Supplementary Table 1.
Region of interest
pi-2022-0174-suppl2.pdf
Supplementary Table 2.
Edges showing significantly decreased functional connectivity in preschool children with autism spectrum disorder
pi-2022-0174-suppl3.pdf
Supplementary Figure 1.
Group differences between the preschool children (age, 2-6 years) of the autism spectrum disorder group and typical development group. The edges show significantly increased SLD in the ASD group (red: p<0.05, FDR corrected; yellow: p<0.00005, uncorrected). ASD group, children with autism spectrum disorder; FDR, false discovery rate; IFG, inferior frontal gyrus; IPL, inferior parietal lobule; ITG, inferior temporal gyrus; L, left; R, right; SFG, superior frontal gyrus; SLD, single linkage distance; STG, superior temporal gyrus; TD group, children with typical development.
pi-2022-0174-suppl4.pdf
Supplementary Figure 2.
Distribution of the correlation coefficients. The distribution of the correlation coefficients between the groups with and without sedation represented by light pink and light purple colors, respectively, is shown here. To compare the shape of this distribution, the kurtosis of the correlation distribution of each participant was compared between the groups with and without sedation. The mean peakness of the correlation distribution was higher in the group with sedation than in the group without sedation (p<0.05), indicating that there are more edges with connectivity values closer to zero in the sedation group (ASD group, children with autism spectrum disorder; TD group, children with typical development). *The significant difference of mean peakness was found at p<0.05.
pi-2022-0174-suppl5.pdf

Notes

Availability of Data and Material

The datasets generated or analyzed during the study are available from the corresponding author on reasonable request.

Conflicts of Interest

The authors have no potential conflicts of interest to disclose.

Author Contributions

Conceptualization: Narae Yoon, Hyejin Kang, Bung-Nyun Kim. Data curation: Mee Rim Oh. Formal analysis: Youngmin Huh, Hyekyoung Lee, Hyejin Kang. Funding acquisition: Dong Soo Lee, Bung-Nyun Kim. Investigation: Narae Yoon, Hyejin Kang. Methodology: Youngmin Huh, Hyekyoung Lee, Hyejin Kang. Supervision: Dong Soo Lee, Bung-Nyun Kim. Visualization: Hyejin Kang. Writing—original draft: Narae Yoon, Hyejin Kang. Writing—review & editing: Soomin Jang, Yebin D. Ahn, Chan-Mo Yang, Jung Lee, Johanna Inhyang Kim, Dong Soo Lee, Bung-Nyun Kim.

Funding Statement

This research was supported by the Bio & Medical Technology Development Program of the National Research Foundation (NRF) funded by the Korean government (MSIT) (No. 2020M3E5D9080787 to B.-N.K and 2020R1A2C2011532 to H.K.), the Technology Innovation Program (Industrial Strategic Technology Development Program) (No. 20002769, Development of Next Generation Platform for Diagnosis and Therapeutic of Attention Deficit Hyperactivity Disorder and Intellectual Disability based on Big Data) funded by the Ministry of Trade, Industry, and Energy (MOTIE, Korea) and Institute of Information & communications Technology Planning & Evaluation (IITP) grant funded by the Korea government (MSIT) (No. 2022-0-00375-001, The Development of Biomarkers based Individualized Composite Digital Therapeutics for the relief of Aberrant Behaviors in Autism Spectrum Disorder).

Figure 1.
Edges with significantly decreased functional connectivity and their correlations with clinical scores. Edges with significantly increased SLD corresponding decreased connectivity are shown (p<0.01, FDR corrected) (left). The ASD children showed increased distance between the bilateral cingulate gyri and between bilateral precuneus. Edges with increased distance were also observed between the IPL and the frontal/temporal regions. Significant correlations were found between edges showing increased distance and the clinical scores (right, p<0.05). The distance between the right IPL and left IFG positively correlated with the SRS communication, SRS social awareness, and SCI. The distance between the left IPL and the left IFG positively correlated with the SRS communication. Additionally, the distance between bilateral cingulate gyri positively correlated with the CARS and SRS communication. IFG, inferior frontal gyrus; IPL, inferior parietal lobule; ITG, inferior temporal gyrus; Pcun, precuneus; CG, cingulate gyrus; SFG, superior frontal gyrus; STG, superior temporal gyrus; R, right; L, left; CARS, Childhood Autism Rating Scale; SLD, single linkage distance; ASD, autism spectrum disorder; TD, typical development; SRS, Social Responsiveness Scale; SRS awareness, Social Responsiveness Scale social awareness; SRS communication, Social Responsiveness Scale communication; FDR, false discovery rate; SCI, Social Communication Index.
pi-2022-0174f1.jpg
Figure 2.
The global efficiency. The ASD group showed significantly decreased global efficiency as compared to the TD group (p<0.005). Violin plots of the ASD and TD groups are shown in red and blue, respectively. The individual circle denotes the global efficiency of each participant (red: ASD; blue: TD). The group average is shown as a gray horizontal line, and white circles represent the median of each group. The filled gray box in the center of each group represents the middle 50%, i.e., the range between the 25th and 75th percentiles (ASD group, children with autism spectrum disorder; Eglobal, global efficiency; TD group, children with typical development). *the significant difference was found at p<0.005.
pi-2022-0174f2.jpg
Figure 3.
Nodes showing a significant increase in the ASD group. A: The local efficiency of the left IFG and cingulate gyrus decreased in the ASD group (p<0.05, FDR corrected). B: The ASD group also showed significantly decreased nodal efficiency in the frontal, parietal, right insula, and visual areas (p<0.05, FDR corrected). IFG, inferior frontal gyrus; CG, cingulate gyrus; MFG, middle frontal gyrus; SFG, superior frontal gyrus; IPL, inferior parietal lobule; ITG, inferior temporal gyrus; CB, cerebellum; INS, insula; L, left; LOcC, lateraloccipital gyrus; MTG, middle temporal gyrus; Pcun, precuneus; PoG, postcentral gyrus; PrG, precentral gyrus; R, right; SPL, superior parietal lobule; STG, superior temporal gyrus; STS, superior temporal sulcus; ASD group, children with autism spectrum disorder; FDR, false discovery rate.
pi-2022-0174f3.jpg
Table 1.
Demographic and clinical characteristics
Variables ASD (N=31)
TD (N=31)
p-value
Mean±SD N Mean±SD N
Age (yr) 5.61±2.53 31 5.65±2.48 31
Sex
Boy 19 19
Girl 12 12
Sedation 30 15
ADOS
Communication 5.56±1.45 27 - -
Social interaction 8.93±2.51 27 - -
Total 14.56±3.62 27 - -
FSIQ 60.12±20.48 26 108.76±16.92 29 <0.001
CARS 29.86±6.29 29 15.52±0.73 28 <0.001
SRS
Awareness 11.94±3.58 17 5.95±3.02 21 <0.001
Cognition 20.00±5.10 17 7.05±3.25 21 <0.001
Communication 33.18±9.37 17 7.62±4.54 21 <0.001
Motivation 12.88±5.94 17 5.43±3.60 21 <0.001
Responsiveness 13.59±5.73 17 3.81±3.46 21 <0.001
Social communication index 78.00±21.44 17 26.05±11.75 21 <0.001
Total 91.59±26.54 17 29.86±13.57 21 <0.001

ADOS, Autism Diagnostic Observation Schedule; ASD, autism spectrum disorder; CARS, Childhood Autism Rating Scale; FSIQ, Full Scale IQ; SD, standard deviation; SRS, Social Responsiveness Scale; TD, typical development

Table 2.
Edges showing significantly decreased functional connectivity in individuals with autism spectrum disorder
Connectivity
Clinical correlation
ROI 1 ROI 2 p-value (FDR) ASD group
TD group
rho p % sub rho p % sub
Right, cingulate, dorsal area 23 Left, cingulate, dorsal area 23 <0.01 CARS 0.45 0.02 93.55 0.40 0.03 93.55
SRS Com 0.68 <0.01 54.84 0.00 >0.99 54.84
Right, precuneus, area 31 Left, precuneus, are 31 <0.01
Right, inferior parietal lobule, rostroventral area 40 Left, inferior frontal gyrus, caudal area 45 <0.01 SRS Com 0.68 <0.01 54.84 0.14 0.59 54.84
SRS Awa 0.52 0.03 54.84 0.27 0.29 54.84
SCI 0.52 0.03 54.84 0.19 0.47 54.84
Left, Inferior parietal lobule, rostroventral area 40 Right, superior frontal gyrus, medial area 9 <0.01
Left, inferior frontal gyrus, caudal area 45 <0.01 SRS Com 0.54 0.02 54.84 0.00 0.99 54.84
Right, superior temporal gyrus, rostral area 22 <0.01
Left, inferior temporal gyrus, ventrolateral area 37 <0.01

ASD group, children with autism spectrum disorder; Awa; social awareness; CARS, Childhood Autism Rating Scale; com; communication; FDR, false discovery rate; ROI, region of interest; SCI, Social Communications Index; SRS, Social Responsiveness Scale; TD group, children with typical development; % sub, the percentage of subjects who have clinical score

Table 3.
Areas showing significantly decreased local/nodal efficiency in individuals with autism spectrum disorder
Network measure ROI p-value (FDR corrected)
Local efficiency
Left, cingulate gyrus, subgenual area 32 <0.05 FWER
Left, inferior frontal gyrus, caudal area 45 <0.05 FWER
Nodal efficiency
 Frontal lobe Right, superior frontal gyrus, dorsolateral area 8 <0.01
Right, superior frontal gyrus, lateral area 9 <0.05
Right, superior frontal gyrus, medial area 9 <0.05
Right, superior frontal gyrus, medial area 10 <0.05
Left, superior frontal gyrus, medial area 10 <0.05
Left, superior frontal gyrus, medial area 9 <0.05
Right, middle frontal gyrus, inferior frontal junction <0.05
Right, middle frontal gyrus ventral area 9/46 <0.05
Left, middle frontal gyrus ventral area 9/46 <0.05
Right, inferior frontal gyrus, inferior frontal sulcus <0.05
Right, inferior frontal gyrus, caudal area 45 <0.05
Right, inferior frontal gyrus, ventral area 44 <0.01
Left, Inferior frontal gyrus, ventral area 44 <0.05
Left, inferior frontal gyrus, caudal area 45 <0.05 FWER
Right, precentral gyrus, area 4 (head and face region) <0.01
Right, precentral gyrus, area 4 (upper limb region) <0.01
Right, precentral gyrus, area 4 (tongue and larynx region) <0.01
Right, precentral gyrus, caudal ventrolateral area 6 <0.05
Left, precentral gyrus, caudal ventrolateral area 6 <0.05
Left, precentral gyrus, area 4 (tongue and larynx region) <0.05
 Temporal lobe Right, superior temporal gyrus, area 41/42 <0.01
Right, superior temporal gyrus, caudal area 22 <0.05
Right, superior temporal gyrus, rostral area 22 <0.05
Left, middle temporal gyrus, dorsolateral area 37 <0.05
Left, inferior temporal gyrus, caudolateral of area 20 <0.05
Right, superior temporal sulcus, rostroposterior <0.05
 Parietal lobe Right, superior parietal lobule, rostral area 7 <0.05
Right, superior parietal lobule, caudal area 7 <0.01
Right, superior parietal lobule, lateral area 5 <0.05 FWER
Right, superior parietal lobule, postcentral area 7 <0.05 FWER
Right, superior parietal lobule, intraparietal area 7 <0.01
Left, superior parietal lobule, intraparietal area 7 <0.05 FWER
Left, superior parietal lobule, postcentral area 7 <0.01
Left, superior parietal lobule, lateral area 5 <0.05 FWER
Left, superior parietal lobule, caudal area 7 <0.05 FWER
Left, Superior parietal lobule, rostral area 7 <0.01
Right, Inferior parietal lobule, rostrodorsal area 39 <0.05
Right, Inferior parietal lobule, rostrodorsal area 40 <0.01
Right, inferior parietal lobule, rostroventral area 40 <0.01
Left, inferior parietal lobule, rostroventral area 40 <0.01
Left, inferior parietal lobule, rostroventral area 39 <0.01
Left, inferior parietal lobule, rostrodorsal area 40 <0.05
Right, precuneus, medial area 7 <0.05
Right, precuneus, area 31 <0.01
Left, precuneus, area 31 <0.05
Left, precuneus, medial area 7 <0.05
Right, postcentral gyrus, area 1/2/3 (upper limb, head and face region) <0.05
Right, postcentral gyrus, area 1/2/3 (tongue and larynx region) <0.05
FWER Right, postcentral gyrus, area 2 <0.05
Right, postcentral gyrus, area 1/2/3 (trunk region) <0.05
Left, postcentral gyrus, area 2 <0.01
Left, postcentral gyrus, area 1/2/3 (tongue and larynx region) <0.01
Left, postcentral gyrus, area 1/2/3 (upper limb, head and face region) <0.05
 Insula Right, insula, hypergranular insula <0.05
Right, insula, dorsal granular insula <0.01
Left, insula, dorsal granular insula <0.05
Left, hypergranular insula <0.05
 Cingulate Right, cingulate gyrus, dorsal area 23 <0.05
Right, cingulate gyrus, subgenual area 32 <0.05
Left, cingulate gyrus, subgenual area 32 <0.05
 Occipital Right, lateral occipital, medial superior occipital gyrus <0.05
Right, lateral occipital, lateral superior occipital gyrus <0.05 FWER
Left, lateral occipital, lateral superior occipital gyrus <0.05 FWER
Left, lateral occipital, medial superior occipital gyrus <0.05
 Cerebellum Cerebellar crus II <0.05

FDR, false discovery rate; FWER, family-wise error rate; ROI, region of interest

Table 4.
Associations between the significantly decreased local/nodal efficiencies and the clinical scores
Network measure Clinical score Significant node
ASD group
TD group
ROI rho p-value % sub rho p-value % sub
Local efficiency ADOS total
Left, cingulate gyrus, subgenual area 32 -0.45 0.02 87.10
ADOS social interaction
Left, cingulate gyrus, subgenual area 32 -0.53 <0.01 87.10 - - -
Nodal efficiency
CARS
Left, superior parietal lobule, lateral area 5 -0.42 0.02 93.55 0.23 0.23 90.32
Left, superior parietal lobule, intraparietal area 7 -0.42 0.02 93.55 0.19 0.33 90.32
Left, precuneus, medial area 7 -0.55 <0.01 93.55 0.18 0.36 90.32
Left, lateral superior occipital gyrus -0.38 0.04 93.55 0.14 0.49 90.32
Right, inferior parietal lobule, rostrodorsal area 40 -0.41 0.03 93.55 -0.06 0.78 90.32
ADOS, communications
Left, cerebellar crus II 0.54 <0.01 87.10 - - -
ADOS social interaction
Left, cingulate gyrus, subgenual area 32 -0.57 <0.01 87.10
Left, precuneus, medial area 7 -0.50 0.01 87.10
Right, superior frontal gyrus, lateral area 9 -0.40 0.04 87.10
Right, superior frontal gyrus, medial area 10 -0.40 0.04 87.10
Left, superior frontal gyrus, medial area 9 -0.40 0.04 87.10 - - -
ADOS total
Left, cingulate gyrus, subgenual area 32 -0.52 0.01 87.10 - - -
Left, precuneus, medial area 7 -0.47 0.01 87.10 - - -
Left, inferior parietal lobule, rostrodorsal area 40 -0.41 0.03 87.10 - - -
Right, superior frontal gyrus, medial area 10 -0.39 0.04 87.10 - - -
SRS Communication
Left, lateral superior occipital gyrus -0.58 0.01 54.84 -0.27 0.23 67.74
Left, inferior temporal gyrus, caudolateral of area 20 -0.57 0.02 54.84 0.10 0.68 67.74
SRS Cognition
Right, lateral superior occipital gyrus -0.51 0.04 54.84 -0.27 0.23 67.74
SRS restricted interests and repetitive behavior
Right, precentral gyrus, area 4 (upper limb region) -0.52 0.03 54.84 -0.46 0.04 67.74
Right, lateral superior occipital gyrus -0.50 0.04 54.84 0.04 0.85 67.74
SCI
Left, lateral superior occipital gyrus -0.49 0.04 54.84 -0.30 0.19 67.74
SRS total
Left, lateral superior occipital gyrus -0.48 0.05 54.84 -0.37 0.10 67.74

ADOS, Autism Diagnostic Observation Schedule; ASD group, children with autism spectrum disorder; CARS, Childhood Autism Rating Scale; SCI, Social Communications Index; SRS, Social Responsiveness Scale; TD group, children with typical development

REFERENCES

1. DiCicco-Bloom E, Lord C, Zwaigenbaum L, Courchesne E, Dager SR, Schmitz C, et al. The developmental neurobiology of autism spectrum disorder. J Neurosci 2006;26:6897-6906.
crossref pmid pmc
2. Stigler KA, McDonald BC, Anand A, Saykin AJ, McDougle CJ. Structural and functional magnetic resonance imaging of autism spectrum disorders. Brain Res 2011;1380:146-161.
crossref pmid
3. Fakhoury M. Imaging genetics in autism spectrum disorders: linking genetics and brain imaging in the pursuit of the underlying neurobiological mechanisms. Prog Neuropsychopharmacol Biol Psychiatry 2018;80(Pt B):101-114.
crossref pmid
4. Belger A, Carpenter KL, Yucel GH, Cleary KM, Donkers FC. The neural circuitry of autism. Neurotox Res 2011;20:201-214.
crossref pmid pmc pdf
5. Shafritz KM, Dichter GS, Baranek GT, Belger A. The neural circuitry mediating shifts in behavioral response and cognitive set in autism. Biol Psychiatry 2008;63:974-980.
crossref pmid
6. Plitt M, Barnes KA, Martin A. Functional connectivity classification of autism identifies highly predictive brain features but falls short of biomarker standards. Neuroimage Clin 2015;7:359-366.
crossref pmid
7. Holiga Š, Hipp JF, Chatham CH, Garces P, Spooren W, D’Ardhuy XL, et al. Patients with autism spectrum disorders display reproducible functional connectivity alterations. Sci Transl Med 2019;11:eaat9223
crossref pmid
8. Hull JV, Dokovna LB, Jacokes ZJ, Torgerson CM, Irimia A, Van Horn JD. Resting-state functional connectivity in autism spectrum disorders: a review. Front Psychiatry 2017;7:205
crossref pmid pmc
9. Rudie JD, Brown JA, Beck-Pancer D, Hernandez LM, Dennis EL, Thompson PM, et al. Altered functional and structural brain network organization in autism. Neuroimage Clin 2013;2:79-94.
crossref
10. Picci G, Gotts SJ, Scherf KS. A theoretical rut: revisiting and critically evaluating the generalized under/over-connectivity hypothesis of autism. Dev Sci 2016;19:524-549.
crossref pmid pdf
11. Lau WKW, Leung MK, Lau BWM. Resting-state abnormalities in autism spectrum disorders: a meta-analysis. Sci Rep 2019;9:3892
crossref pmid pmc pdf
12. Haghighat H, Mirzarezaee M, Araabi BN, Khadem A. Functional networks abnormalities in autism spectrum disorder: age-related hypo and hyper connectivity. Brain Topogr 2021;34:306-322.
crossref pmid pdf
13. Harikumar A, Evans DW, Dougherty CC, Carpenter KLH, Michael AM. A review of the default mode network in autism spectrum disorders and attention deficit hyperactivity disorder. Brain Connect 2021;11:253-263.
crossref pmid pmc
14. Nair A, Jolliffe M, Lograsso YSS, Bearden CE. A review of default mode network connectivity and its association with social cognition in adolescents with autism spectrum disorder and early-onset psychosis. Front Psychiatry 2020;11:614
crossref pmid pmc
15. Chen H, Duan X, Liu F, Lu F, Ma X, Zhang Y, et al. Multivariate classification of autism spectrum disorder using frequency-specific restingstate functional connectivity--a multi-center study. Prog Neuropsychopharmacol Biol Psychiatry 2016;64:1-9.
crossref pmid
16. Uddin LQ, Supekar K, Lynch CJ, Khouzam A, Phillips J, Feinstein C, et al. Salience network-based classification and prediction of symptom severity in children with autism. JAMA Psychiatry 2013;70:869-879.
crossref pmid pmc
17. Mars RB, Neubert FX, Noonan MP, Sallet J, Toni I, Rushworth MF. On the relationship between the “default mode network” and the “social brain”. Front Hum Neurosci 2012;6:189
crossref pmid pmc
18. Yerys BE, Gordon EM, Abrams DN, Satterthwaite TD, Weinblatt R, Jankowski KF, et al. Default mode network segregation and social deficits in autism spectrum disorder: evidence from non-medicated children. Neuroimage Clin 2015;9:223-232.
crossref pmid pmc
19. Nielsen JA, Zielinski BA, Fletcher PT, Alexander AL, Lange N, Bigler ED, et al. Multisite functional connectivity MRI classification of autism: ABIDE results. Front Hum Neurosci 2013;7:599
crossref pmid pmc
20. Ypma RJ, Moseley RL, Holt RJ, Rughooputh N, Floris DL, Chura LR, et al. Default mode hypoconnectivity underlies a sex-related autism spectrum. Biol Psychiatry Cogn Neurosci Neuroimaging 2016;1:364-371.
crossref pmid pmc
21. Lynch CJ, Uddin LQ, Supekar K, Khouzam A, Phillips J, Menon V. Default mode network in childhood autism: posteromedial cortex heterogeneity and relationship with social deficits. Biol Psychiatry 2013;74:212-219.
crossref pmid pmc
22. Yao Z, Hu B, Xie Y, Zheng F, Liu G, Chen X, et al. Resting-state timevarying analysis reveals aberrant variations of functional connectivity in autism. Front Hum Neurosci 2016;10:463
crossref pmid pmc
23. Courchesne E, Gazestani VH, Lewis NE. Prenatal origins of ASD: the when, what, and how of ASD development. Trends Neurosci 2020;43:326-342.
crossref pmid pmc
24. Caputi L, Pidnebesna A, Hlinka J. Promises and pitfalls of topological data analysis for brain connectivity analysis. Neuroimage 2021;238:118245
crossref pmid
25. Lee H, Kang H, Chung MK, Kim BN, Lee DS. Persistent brain network homology from the perspective of dendrogram. IEEE Trans Med Imaging 2012;31:2267-2277.
crossref pmid
26. Ha S, Lee H, Choi Y, Kang H, Jeon SJ, Ryu JH, et al. Maturational delay and asymmetric information flow of brain connectivity in SHR model of ADHD revealed by topological analysis of metabolic networks. Sci Rep 2020;10:3197
crossref pmid pmc pdf
27. Im HJ, Hahm J, Kang H, Choi H, Lee H, Hwang DW, et al. Disrupted brain metabolic connectivity in a 6-OHDA-induced mouse model of Parkinson’s disease examined using persistent homology-based analysis. Sci Rep 2016;6:33875
crossref pmid pmc pdf
28. Lord C, Risi S, Lambrecht L, Cook EH Jr, Leventhal BL, DiLavore PC, et al. The autism diagnostic observation schedule-generic: a standard measure of social and communication deficits associated with the spectrum of autism. J Autism Dev Disord 2000;30:205-223.
pmid
29. Schopler E, Reichler RJ, Renner BR. The childhood autism rating scale (CARS). Los Angeles, CA: Western Psychological Services; 1988.

30. Shin MS, Kim YH. Standardization study for the Korean version of the childhood autism rating scale: reliability, validity and cut-off score. Kor J Clin Psychol 1998;17:1-15.

31. Park KS, Yoon JY, Park HJ, Kwon KU. Korean Educational Development Institute Weschler Intelligence Scale for Children (KEDI-WISC). Seoul: Korean Educational Development Institute; 2002.

32. Roid GH, Miller LJ. Leiter international performance scale-revised (Leiter-R). Wood Dale: Stoelting; 1997, p. 10

33. Shin MS, Cho SC. Korean Leiter international performance scale revised (K-Leiter-R). Seoul: Hakjisa; 2010.

34. Kwak KJ, Oh SW, Kim CT. Korean-Wechsler intelligence scale for children. 4th ed. Seoul: Hakjisa; 2011.

35. Constantino JN. Social responsiveness scale. In: Volkmar FR, editor. Encyclopedia of autism spectrum disorders. New York: Springer, 2013, p. 2919-2929.

36. Patel AX, Kundu P, Rubinov M, Jones PS, Vértes PE, Ersche KD, et al. A wavelet method for modeling and despiking motion artifacts from resting-state fMRI time series. Neuroimage 2014;95:287-304.
crossref pmid
37. Ashburner J, Friston KJ. Unified segmentation. Neuroimage 2005;26:839-851.
crossref pmid
38. Fonov VS, Evans AC, McKinstry RC, Almli CR, Collins DL. Unbiased nonlinear average age-appropriate brain templates from birth to adulthood. NeuroImage 2009;47(Supplement 1):S102
crossref
39. Fonov V, Evans AC, Botteron K, Almli CR, McKinstry RC, Collins DL; Brain Development Cooperative Group. Unbiased average age-appropriate atlases for pediatric studies. Neuroimage 2011;54:313-327.
crossref pmid
40. Fan L, Li H, Zhuo J, Zhang Y, Wang J, Chen L, et al. The human brainnetome atlas: a new brain atlas based on connectional architecture. Cereb Cortex 2016;26:3508-3526.
crossref pmid pmc
41. Diedrichsen J, Balsters JH, Flavell J, Cussans E, Ramnani N. A probabilistic MR atlas of the human cerebellum. Neuroimage 2009;46:39-46.
crossref pmid
42. Rubinov M, Sporns O. Complex network measures of brain connectivity: uses and interpretations. Neuroimage 2010;52:1059-1069.
crossref pmid
43. Achard S, Bullmore E. Efficiency and cost of economical brain functional networks. PLoS Comput Biol 2007;3:e17
crossref pmid pmc
44. Glerean E, Pan RK, Salmi J, Kujala R, Lahnakoski JM, Roine U, et al. Reorganization of functionally connected brain subnetworks in highfunctioning autism. Hum Brain Mapp 2016;37:1066-1079.
crossref pmid pdf
45. He C, Chen Y, Jian T, Chen H, Guo X, Wang J, et al. Dynamic functional connectivity analysis reveals decreased variability of the defaultmode network in developing autistic brain. Autism Res 2018;11:1479-1493.
crossref pmid pdf
46. Moseley RL, Ypma RJ, Holt RJ, Floris D, Chura LR, Spencer MD, et al. Whole-brain functional hypoconnectivity as an endophenotype of autism in adolescents. Neuroimage Clin 2015;9:140-152.
crossref pmid pmc
47. Uddin LQ, Iacoboni M, Lange C, Keenan JP. The self and social cognition: the role of cortical midline structures and mirror neurons. Trends Cogn Sci 2007;11:153-157.
crossref pmid
48. Andrews-Hanna JR, Reidler JS, Sepulcre J, Poulin R, Buckner RL. Functional-anatomic fractionation of the brain’s default network. Neuron 2010;65:550-562.
crossref pmid pmc
49. Buckner RL, Andrews-Hanna JR, Schacter DL. The brain’s default network: anatomy, function, and relevance to disease. Ann N Y Acad Sci 2008;1124:1-38.
pmid
50. Parlatini V, Radua J, Dell’Acqua F, Leslie A, Simmons A, Murphy DG, et al. Functional segregation and integration within fronto-parietal networks. Neuroimage 2017;146:367-375.
crossref pmid
51. Oberman LM, Ramachandran VS. The simulating social mind: the role of the mirror neuron system and simulation in the social and communicative deficits of autism spectrum disorders. Psychol Bull 2007;133:310-327.
crossref pmid
52. Yang J, Hofmann J. Action observation and imitation in autism spectrum disorders: an ALE meta-analysis of fMRI studies. Brain Imaging Behav 2016;10:960-969.
crossref pmid pdf
53. Wymbs NF, Nebel MB, Ewen JB, Mostofsky SH. Altered inferior parietal functional connectivity is correlated with praxis and social skill performance in children with autism spectrum disorder. Cereb Cortex 2021;31:2639-2652.
crossref pmid pdf
54. Nishitani N, Avikainen S, Hari R. Abnormal imitation-related cortical activation sequences in Asperger’s syndrome. Ann Neurol 2004;55:558-562.
crossref pmid
55. Pfeifer JH, Iacoboni M, Mazziotta JC, Dapretto M. Mirroring others’ emotions relates to empathy and interpersonal competence in children. Neuroimage 2008;39:2076-2085.
crossref pmid
56. Williams JH, Waiter GD, Gilchrist A, Perrett DI, Murray AD, Whiten A. Neural mechanisms of imitation and ‘mirror neuron’ functioning in autistic spectrum disorder. Neuropsychologia 2006;44:610-621.
crossref pmid
57. Shih P, Shen M, Ottl B, Keehn B, Gaffrey MS, Müller RA. Atypical network connectivity for imitation in autism spectrum disorder. Neuropsychologia 2010;48:2931-2939.
crossref pmid pmc
58. Keown CL, Datko MC, Chen CP, Maximo JO, Jahedi A, Müller RA. Network organization is globally atypical in autism: a graph theory study of intrinsic functional connectivity. Biol Psychiatry Cogn Neurosci Neuroimaging 2017;2:66-75.
crossref pmid pmc
59. Itahashi T, Yamada T, Watanabe H, Nakamura M, Jimbo D, Shioda S, et al. Altered network topologies and hub organization in adults with autism: a resting-state fMRI study. PLoS One 2014;9:e94115
crossref pmid pmc
60. Hadjikhani N, Joseph RM, Snyder J, Tager-Flusberg H. Anatomical differences in the mirror neuron system and social cognition network in autism. Cereb Cortex 2006;16:1276-1282.
crossref pmid
61. Odriozola P, Uddin LQ, Lynch CJ, Kochalka J, Chen T, Menon V. Insula response and connectivity during social and non-social attention in children with autism. Soc Cogn Affect Neurosci 2016;11:433-444.
crossref pmid
62. Patriquin MA, DeRamus T, Libero LE, Laird A, Kana RK. Neuroanatomical and neurofunctional markers of social cognition in autism spectrum disorder. Hum Brain Mapp 2016;37:3957-3978.
crossref pmid pmc
63. Kana RK, Keller TA, Minshew NJ, Just MA. Inhibitory control in highfunctioning autism: decreased activation and underconnectivity in inhibition networks. Biol Psychiatry 2007;62:198-206.
crossref pmid
64. Lukito S, Norman L, Carlisi C, Radua J, Hart H, Simonoff E, et al. Comparative meta-analyses of brain structural and functional abnormalities during cognitive control in attention-deficit/hyperactivity disorder and autism spectrum disorder. Psychol Med 2020;50:894-919.
crossref pmid pmc
65. Schmitz N, Rubia K, Daly E, Smith A, Williams S, Murphy DG. Neural correlates of executive function in autistic spectrum disorders. Biol Psychiatry 2006;59:7-16.
crossref pmid
66. Schipul SE, Keller TA, Just MA. Inter-regional brain communication and its disturbance in autism. Front Syst Neurosci 2011;5:10
crossref pmid pmc
67. Just MA, Cherkassky VL, Keller TA, Minshew NJ. Cortical activation and synchronization during sentence comprehension in high-functioning autism: evidence of underconnectivity. Brain 2004;127(Pt 8):1811-1821.
crossref pmid
68. Just MA, Cherkassky VL, Keller TA, Kana RK, Minshew NJ. Functional and anatomical cortical underconnectivity in autism: evidence from an FMRI study of an executive function task and corpus callosum morphometry. Cereb Cortex 2007;17:951-961.
crossref pmid
69. Horwitz B, Rumsey JM, Grady CL, Rapoport SI. The cerebral metabolic landscape in autism. Intercorrelations of regional glucose utilization. Arch Neurol 1988;45:749-755.
crossref pmid
70. du Boisgueheneuc F, Levy R, Volle E, Seassau M, Duffau H, Kinkingnehun S, et al. Functions of the left superior frontal gyrus in humans: a lesion study. Brain 2006;129(Pt 12):3315-3328.
crossref pmid
71. Fogassi L, Luppino G. Motor functions of the parietal lobe. Curr Opin Neurobiol 2005;15:626-631.
crossref pmid
72. Goodale MA, Milner AD. Separate visual pathways for perception and action. Trends Neurosci 1992;15:20-25.
crossref pmid
73. Travers BG, Kana RK, Klinger LG, Klein CL, Klinger MR. Motor learning in individuals with autism spectrum disorder: activation in superior parietal lobule related to learning and repetitive behaviors. Autism Res 2015;8:38-51.
crossref pmid pdf
74. Baron-Cohen S, Belmonte MK. Autism: a window onto the development of the social and the analytic brain. Annu Rev Neurosci 2005;28:109-126.
crossref pmid
75. Beauchamp MS. The social mysteries of the superior temporal sulcus. Trends Cogn Sci 2015;19:489-490.
crossref pmid pmc
76. Pelphrey KA, Carter EJ. Charting the typical and atypical development of the social brain. Dev Psychopathol 2008;20:1081-1102.
crossref pmid
77. Kobayashi A, Yokota S, Takeuchi H, Asano K, Asano M, Sassa Y, et al. Increased grey matter volume of the right superior temporal gyrus in healthy children with autistic cognitive style: a VBM study. Brain Cogn 2020;139:105514
crossref pmid
78. Fatemi SH, Aldinger KA, Ashwood P, Bauman ML, Blaha CD, Blatt GJ, et al. Consensus paper: pathological role of the cerebellum in autism. Cerebellum 2012;11:777-807.
crossref pmid pmc pdf
79. Rogers TD, McKimm E, Dickson PE, Goldowitz D, Blaha CD, Mittleman G. Is autism a disease of the cerebellum? An integration of clinical and pre-clinical research. Front Syst Neurosci 2013;7:15
crossref pmid pmc
80. Courchesne E, Yeung-Courchesne R, Press GA, Hesselink JR, Jernigan TL. Hypoplasia of cerebellar vermal lobules VI and VII in autism. N Engl J Med 1988;318:1349-1354.
crossref pmid
81. Tavano A, Grasso R, Gagliardi C, Triulzi F, Bresolin N, Fabbro F, et al. Disorders of cognitive and affective development in cerebellar malformations. Brain 2007;130(Pt 10):2646-2660.
crossref pmid
82. D’Mello AM, Stoodley CJ. Cerebro-cerebellar circuits in autism spectrum disorder. Front Neurosci 2015;9:408
crossref pmid pmc
83. Wang AT, Lee SS, Sigman M, Dapretto M. Reading affect in the face and voice: neural correlates of interpreting communicative intent in children and adolescents with autism spectrum disorders. Arch Gen Psychiatry 2007;64:698-708.
crossref pmid pmc
84. Critchley HD, Daly EM, Bullmore ET, Williams SC, Van Amelsvoort T, Robertson DM, et al. The functional neuroanatomy of social behaviour: changes in cerebral blood flow when people with autistic disorder process facial expressions. Brain 2000;123(Pt 11):2203-2212.
pmid
85. Wang SS, Kloth AD, Badura A. The cerebellum, sensitive periods, and autism. Neuron 2014;83:518-532.
crossref pmid pmc
86. Scott RB, Stoodley CJ, Anslow P, Paul C, Stein JF, Sugden EM, et al. Lateralized cognitive deficits in children following cerebellar lesions. Dev Med Child Neurol 2001;43:685-691.
crossref pmid
87. DiFrancesco MW, Robertson SA, Karunanayaka P, Holland SK. BOLD fMRI in infants under sedation: comparing the impact of pentobarbital and propofol on auditory and language activation. J Magn Reson Imaging 2013;38:1184-1195.
crossref pmid
88. Liu X, Lauer KK, Douglas Ward B, Roberts C, Liu S, Gollapudy S, et al. Propofol attenuates low-frequency fluctuations of resting-state fMRI BOLD signal in the anterior frontal cortex upon loss of consciousness. Neuroimage 2017;147:295-301.
crossref pmid


ABOUT
AUTHOR INFORMATION
ARTICLE CATEGORY

Browse all articles >

BROWSE ARTICLES
Editorial Office
#522, 27, Seochojungang-ro 24-gil, Seocho-gu, Seoul 06601, Korea
Tel: +82-2-717-0892    E-mail: psychiatryinvest@gmail.com                

Copyright © 2024 by Korean Neuropsychiatric Association.

Developed in M2PI

Close layer
prev next